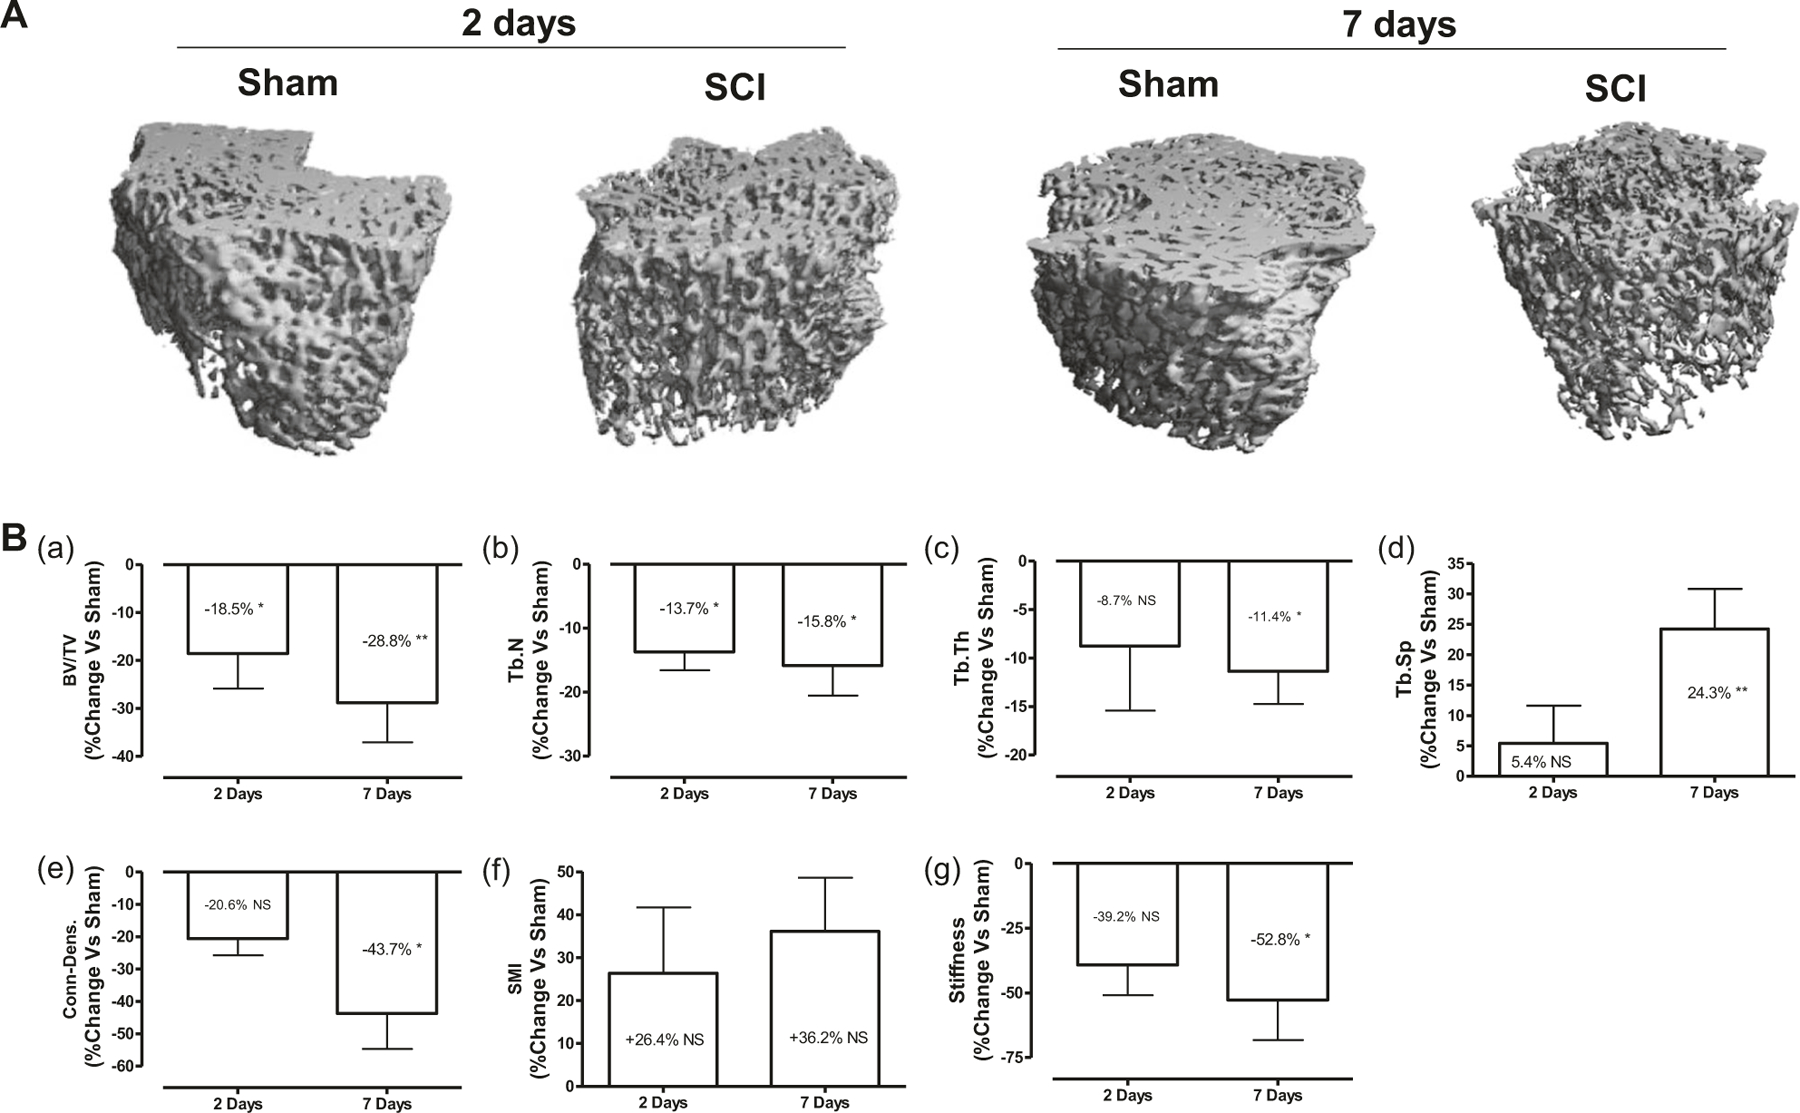
Fig. 2.

Rapid deterioration of bone microstructure after acute SCI. a Representative micro-CT 3D images of trabecular microarchitecture of distal femur are displayed. b Measurements are shown for: (panel a) trabecular bone volume per total tissue volume (BV/TV), (panel b) trabecular number (Tb.N, mm−1), (panel c) trabecular thickness (Tb. Th (mm)), (panel d) trabecular separation (Tb.Sp (mm)), (panel e) connectivity density (conn.D (mm−3)), and (panel f) structure model index (SMI; range from 0 to 3, with 0 = platelike and 3 = rod like). (panel g) Bone stiffness was estimated from micro-finite element analysis (μFEA). The percent change versus Sham group was calculated at 2- and 7-days post-SCI for each outcome measurement and then was plotted in the graph. Data are expressed as mean ± SEM. n = 6–7 animals per group. Significance of differences was determined by using Student’s t-test. *P < 0.05 and **P < 0.01 versus the indicated group. NS not significant
