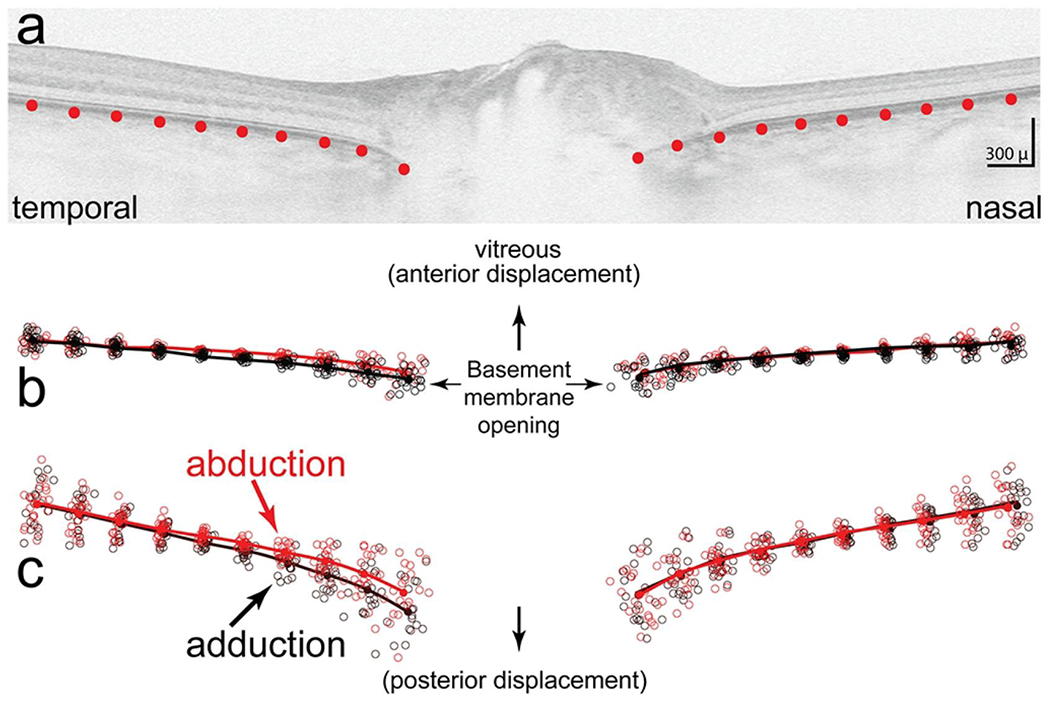
FIGURE 1.

a) Shows the placement of 10 equidistant semi-landmarks spanning 2500 μ on both sides of the basement membrane opening. b) Scatter plot that shows semi-landmarks from each subject in abduction (red circles) and adduction (black circles) after normalizing for location, size and rotation (Procrustes superimposition). The lines show the mean (consensus) shapes for each group (black for adduction, red for abduction). C. vertically stretched three fold to illustrate differences in more detail. Overall, the shape in adduction is posteriorly displaced temporally relative to the nasal side compared to abduction which is more anteriorly displaced. The difference in shapes between abduction and adduction was statistically significant (p < 0.01)
