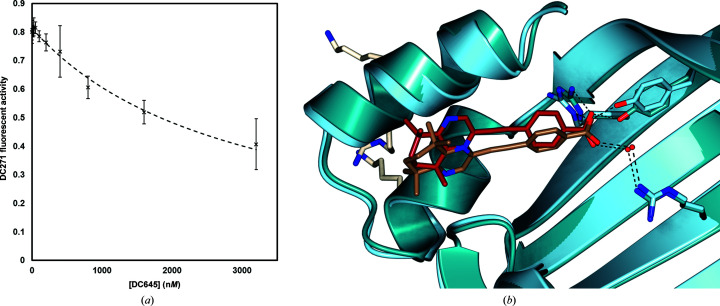
Figure 6.
(a) Competitive displacement of DC271 from CRABPI-L29C by DC645 was carried out using a previously discussed methodology; curve fitting was carried out by least-squares regression using DynaFit (n = 6, α = 0.05; Tomlinson et al., 2018 ▸; Kuzmič, 1996 ▸). (b) Superposition of CRABPII-DC645 (ribbon representation, dark blue; O atoms, red; N atoms, blue) and CRABPI-L29C–DC645 (ribbon representation, pale blue; O atoms, red; N atoms, blue) cut away to show the similarity of the ligand pose (cylinder representation; CRABPII–DC645, brick red; CRABPI-L29C–DC645, brown). The CRABPII nuclear localization sequence is shown (cylinder representation, white; N atoms, blue). The r.m.s.d. on Cα atoms is 0.81 Å.

