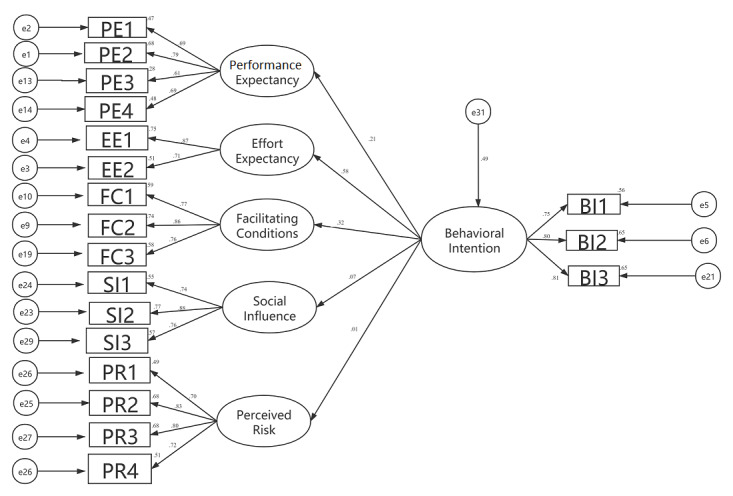
Figure 1.

Results of the structural equation model analysis. Note, e1 to e31 are residuals, which are not explained in the hypothesis equation. The number on each arrow indicates the factor load of the latent variable on the observed variable: the larger the factor load, the better. If the value is greater than .40 and less than 1, the contribution is qualified.
