Figure 4.

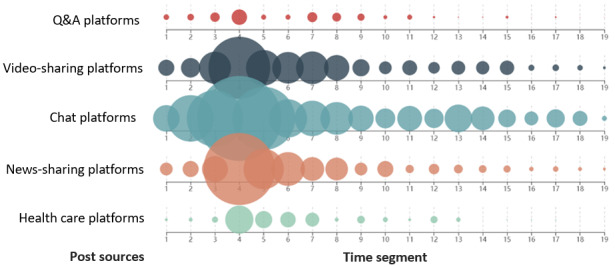
Number of sources of social media posts in each time segment. Different colored dots represent different sources, and their sizes represent the proportion of sources.

Number of sources of social media posts in each time segment. Different colored dots represent different sources, and their sizes represent the proportion of sources.