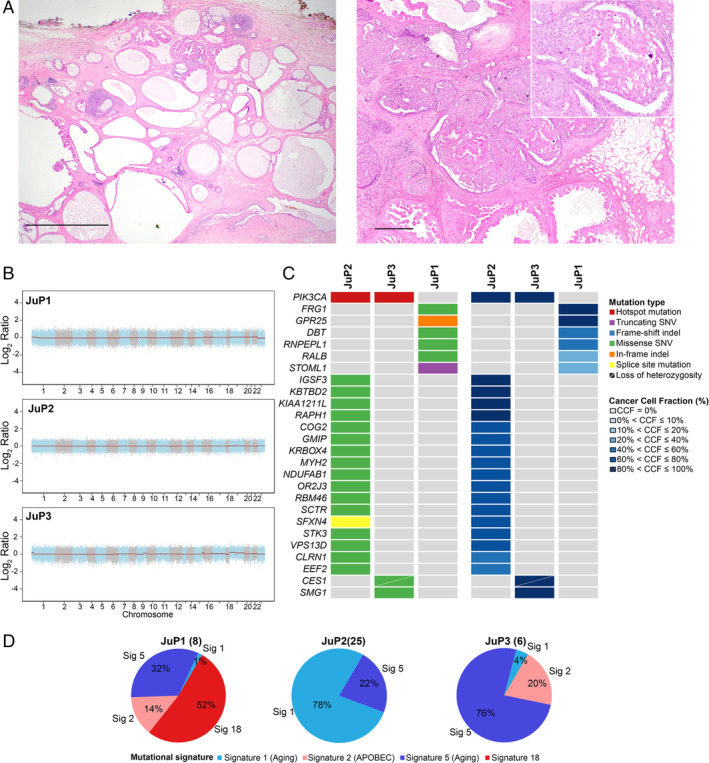
Figure 1.

Histologic features and repertoire of genetic alterations of JP. (A) Representative micrographs of H&E stained sections of JP illustrating the characteristic cystic cut surface (left) and florid hyperplasia with papillary and apocrine features with calcifications (right). Scale bars: left, 2 mm; right, 500 μm. (B) Genome plots depicting Log2 ratios (y‐axis) plotted according to their genomic positions (x‐axis). (C) Heatmaps depicting the nonsynonymous somatic mutations identified by whole‐exome sequencing (left) and cancer cell fraction (CCF) (right). Cases are shown in columns and genes in rows. Mutations and CCF are color‐coded according to the legend. (D) Pie charts showing the mutational signatures as inferred by SigMA. The numbers of synonymous and nonsynonymous mutations of each JP lesion are shown in parentheses.
