Figure 3.

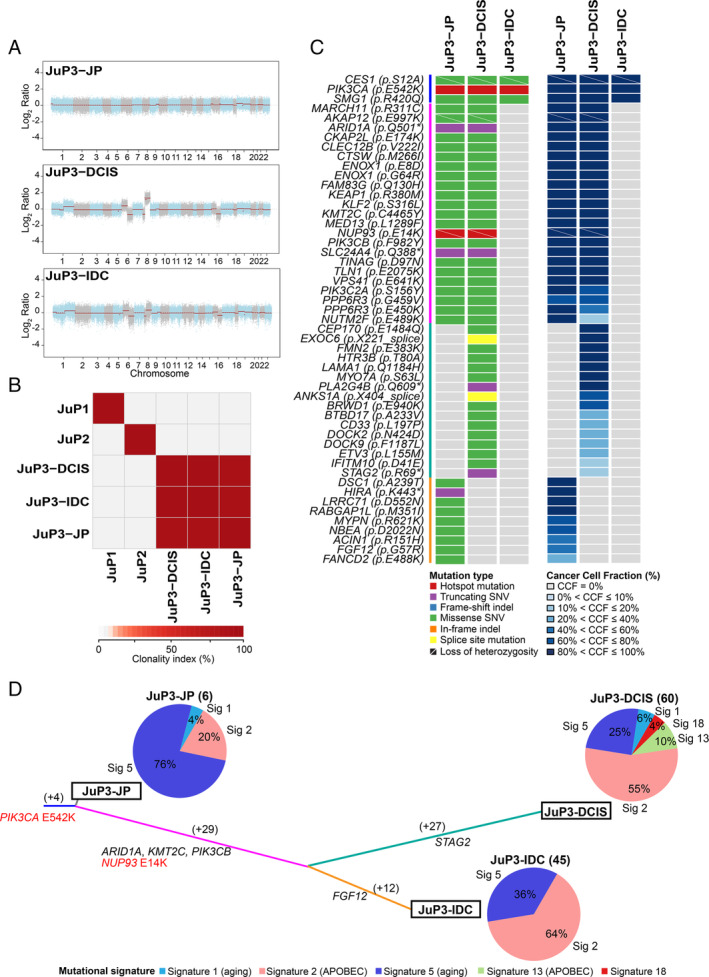
JP and coexisting breast cancer are clonally related. (A) Genome plots depicting Log2 ratios (y‐axis) plotted according to their genomic positions (x‐axis). (B) Pairwise comparison of the clonality index (CI) based on somatic mutations identified in JP lesions JuP1, JuP2 and JuP3 and ductal carcinoma in situ (JuP3‐DCIS) and invasive ductal carcinoma (JuP3‐IDC) coexisting with JuP3 identified by whole exome sequencing. (C) Heatmaps depicting the nonsynonymous somatic mutations identified in the different histologic components of case JuP3 (left) and their cancer cell fraction (CCF) (right). Cases are shown in rows and genes in columns. Mutations and CCF are color‐coded according to the legend. (D) Mutation‐based phylogenetic tree of case JuP3 depicting the clonal evolution of JP and synchronously identified DCIS and IDC‐NST. The lengths of the trunk and branches are proportional to the number of synonymous and nonsynonymous mutations shared or private to a given histologic component. Mutational signatures identified in the different histologic components of case JuP3 using SigMA are depicted in pie charts. The numbers of synonymous and nonsynonymous mutations of each histologic component are shown in parentheses.
