
Figure 4.
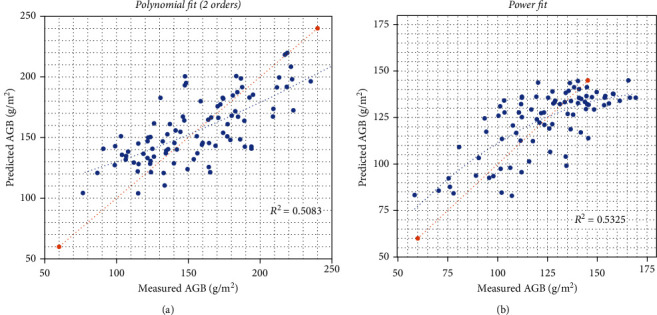
Cross-validation scatter plots for field-measured AGB versus estimated AGB at Location 1 (a) and Location 2 (b) using the best regression model. 1 : 1 line marked as a red discontinuous line and regression line as a blue discontinuous line.