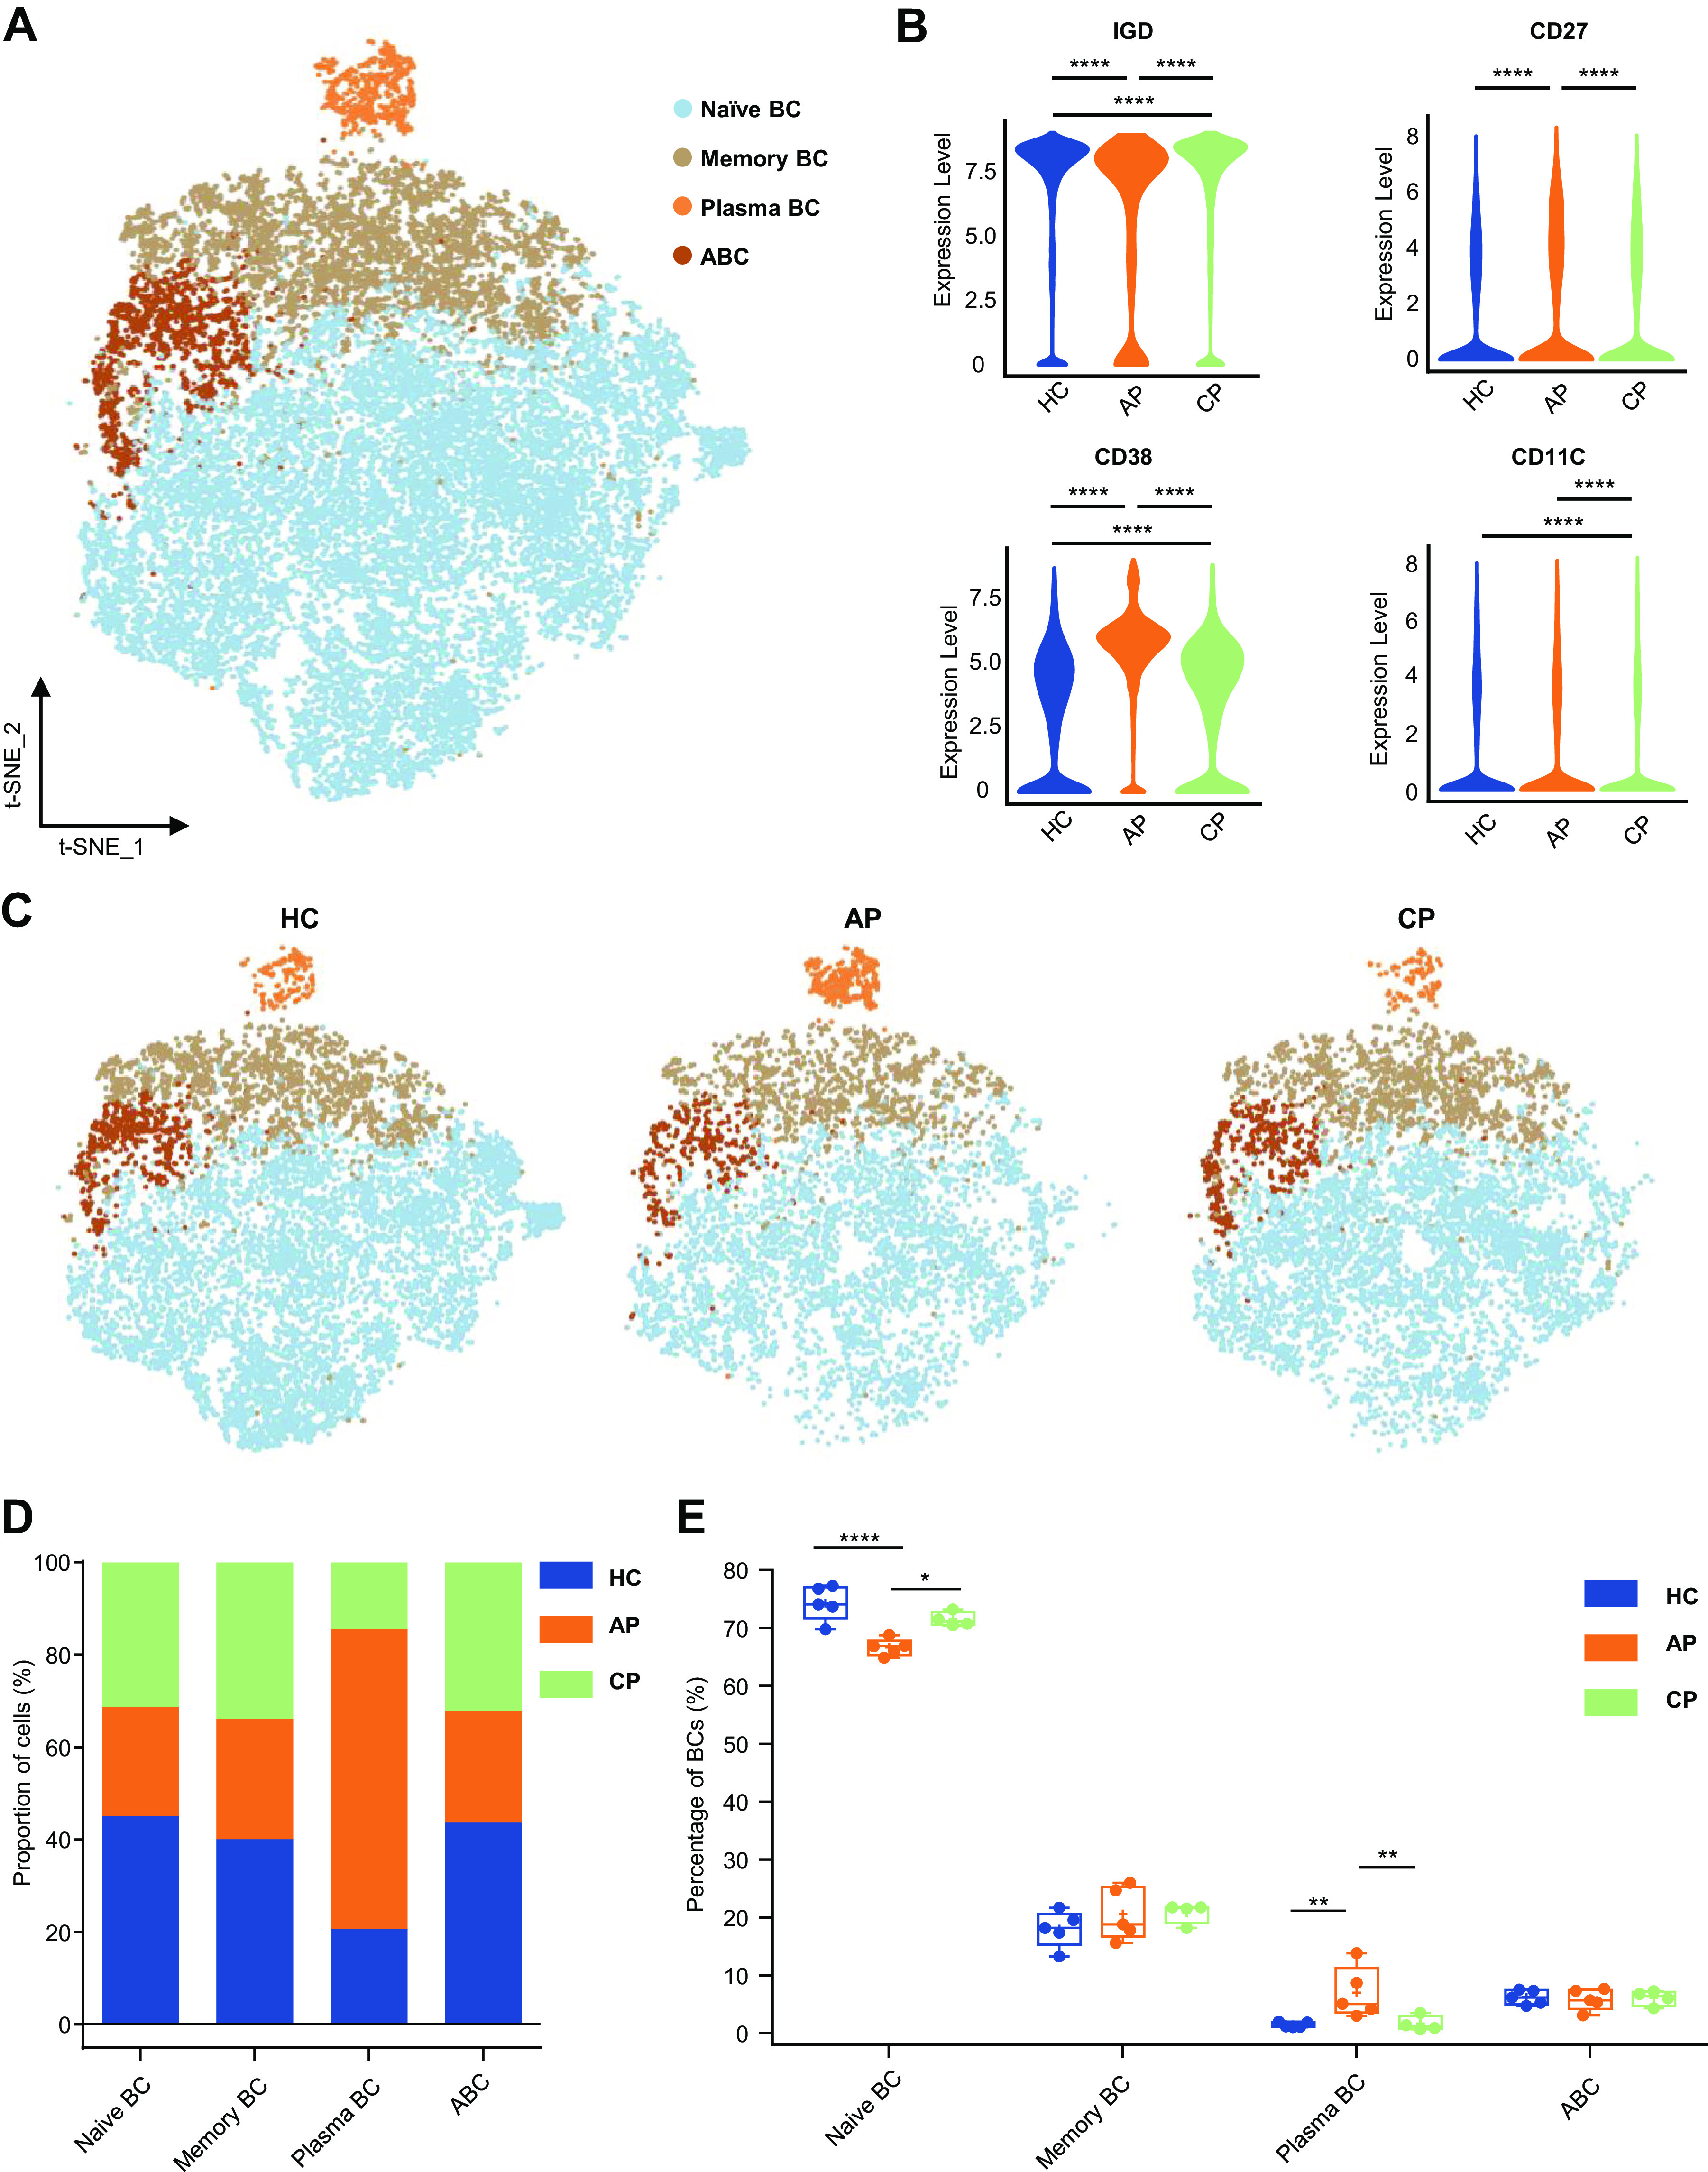
Figure 4.

Characterization of single-cell B cells from mass cytometry data. A: t-distributed stochastic neighbor embedding (t-SNE) plot of major B-cell subsets. Cells are colored on the basis of cell types. B: violin plot showing the expression of IGD, CD27, CD38, and CD11C in the B cells cluster between healthy control (HC), acute phase (AP), and convalescent phase (CP) group. C: t-SNE projections of major B-cell subsets from the HC, AP and CP group. D: bar plots highlighting cell abundances across B cell subsets for the HC, AP, and CP group. E: percentage of major B cell subsets in B cells from the HC (n = 5), AP (n = 5) and CP group (n = 4). Adjusted P values are based on Wilcoxon rank-rum test (marker level) or two-way ANOVA tests with Bonferroni’s post hoc correction (parametric) between groups. ****Significant with adjusted P value < 0.0001; **Significant with adjusted P value < 0.01; *Significant with adjusted P value < 0.05.
