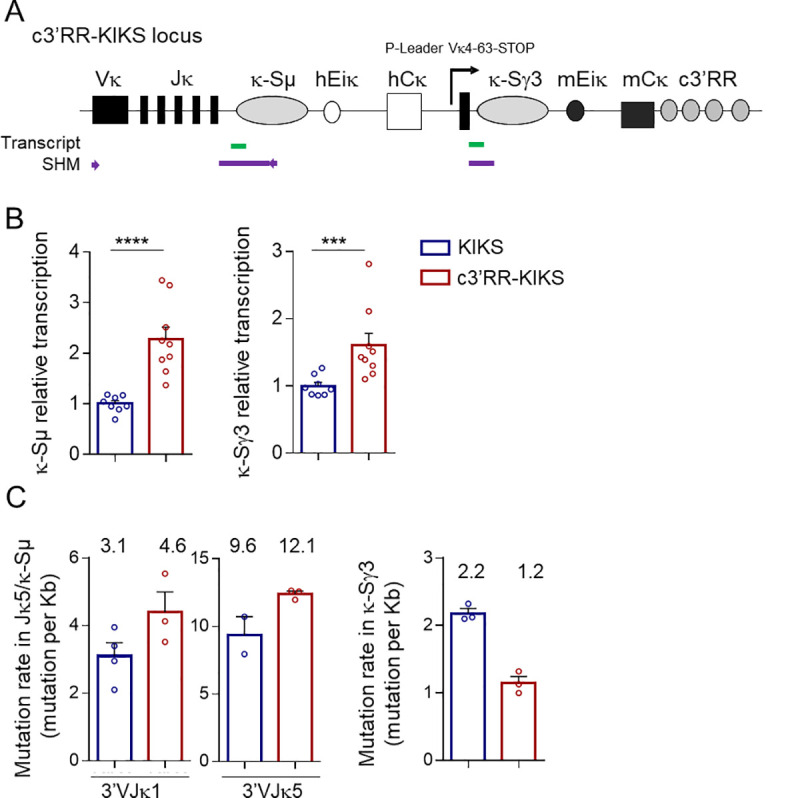
Fig 4. 3’RR core enhancers enhance transcription and SHM.

(A) c3’RR-KIKS locus with the location of regions (thick lines) that were tested either for transcription (green) or for SHM (purple). Arrows represent primers used for SHM PCR amplification. (B) Relative κ-Sμ and κ-Sγ3 region transcripts analyzed in Peyer’s patch GC B-cells (GC) (n = 8 to 9 mice) from KIKS and c3’RR-KIKS mice. (C) Mutation rate in the [3’Jκ5 intron—κ-Sμ] region according to the Jκ rearrangement (Jκ1 or Jκ5) (left and middle panels) and mutation rates in the κ-Sγ3 region (right panel) (n = 2 to 4 individual mice) in GC B cells from KIKS, c3’RR-KIKS and c3’RR-KIKS / Aicda-/- mice. The mutation frequency (mutations per Kb) is indicated over the bar graphs. Data are mean ± SEM, Mann-Whitney test for significance.
