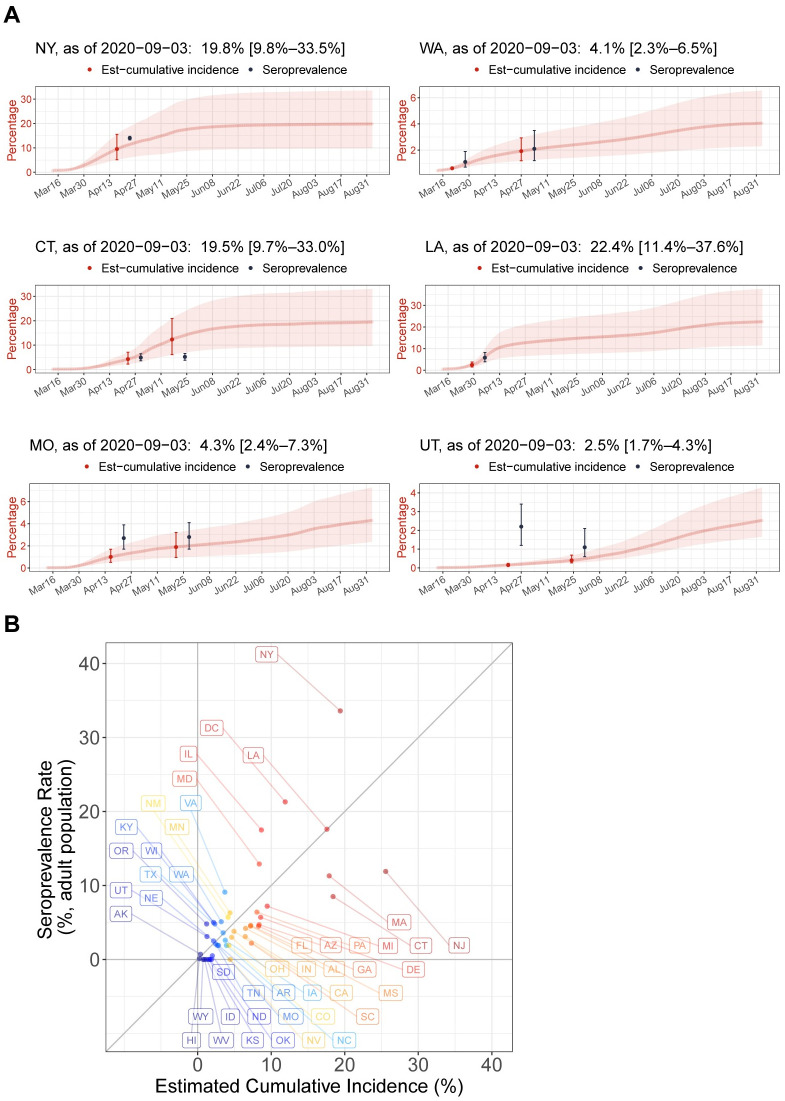
Fig 2. Validation of prediction framework using seroprevalence rates in U.S. states.
(A) Seroprevalence rates in six U.S. states (black) surveyed until May 2020, are overlaid on computationally estimated time courses of cumulative incidence rates (red) from March 13 to September 3, 2020, for New York, Washington state, Connecticut, Louisiana, Missouri, and Utah from upper-left to lower-right. The indicated date of the seroprevalence rate is the mid-point of the serum collection period. The corresponding cumulative incidence estimate is on the date one-week prior to the date of the seroprevalence rate to account for time delays from infection to antibody detection. Error bars and shaded bands indicate 95% confidence intervals. (B) The Y-axis shows the seroprevalence rates in adult (≥18 years) populations of 45 U.S. states and Washington D.C. estimated from a nationwide plasma sample (n = 28,503) of patients on dialysis during July 2020. The X-axis shows the computationally estimated cumulative incidence rates for the states on July 8, 2020, that is one week prior to the mid-point of the plasma sample collection period, July 2020.

