
Fig 1. Cumulative density function of the skewed logit model with different values of skewness.
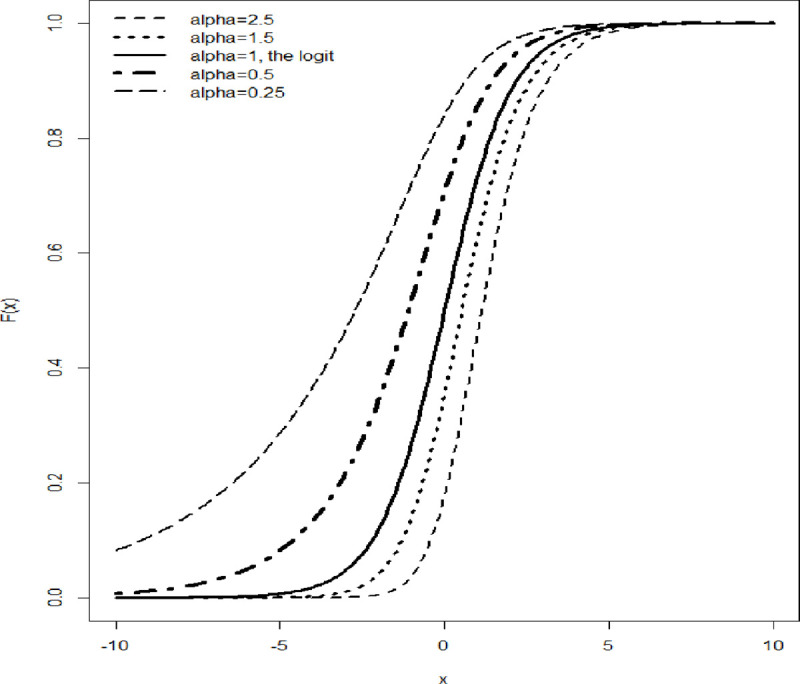
The bold continuous line represents the logit model which assumes symmetry.
Official websites use .gov
A
.gov website belongs to an official
government organization in the United States.
Secure .gov websites use HTTPS
A lock (
) or https:// means you've safely
connected to the .gov website. Share sensitive
information only on official, secure websites.
The bold continuous line represents the logit model which assumes symmetry.