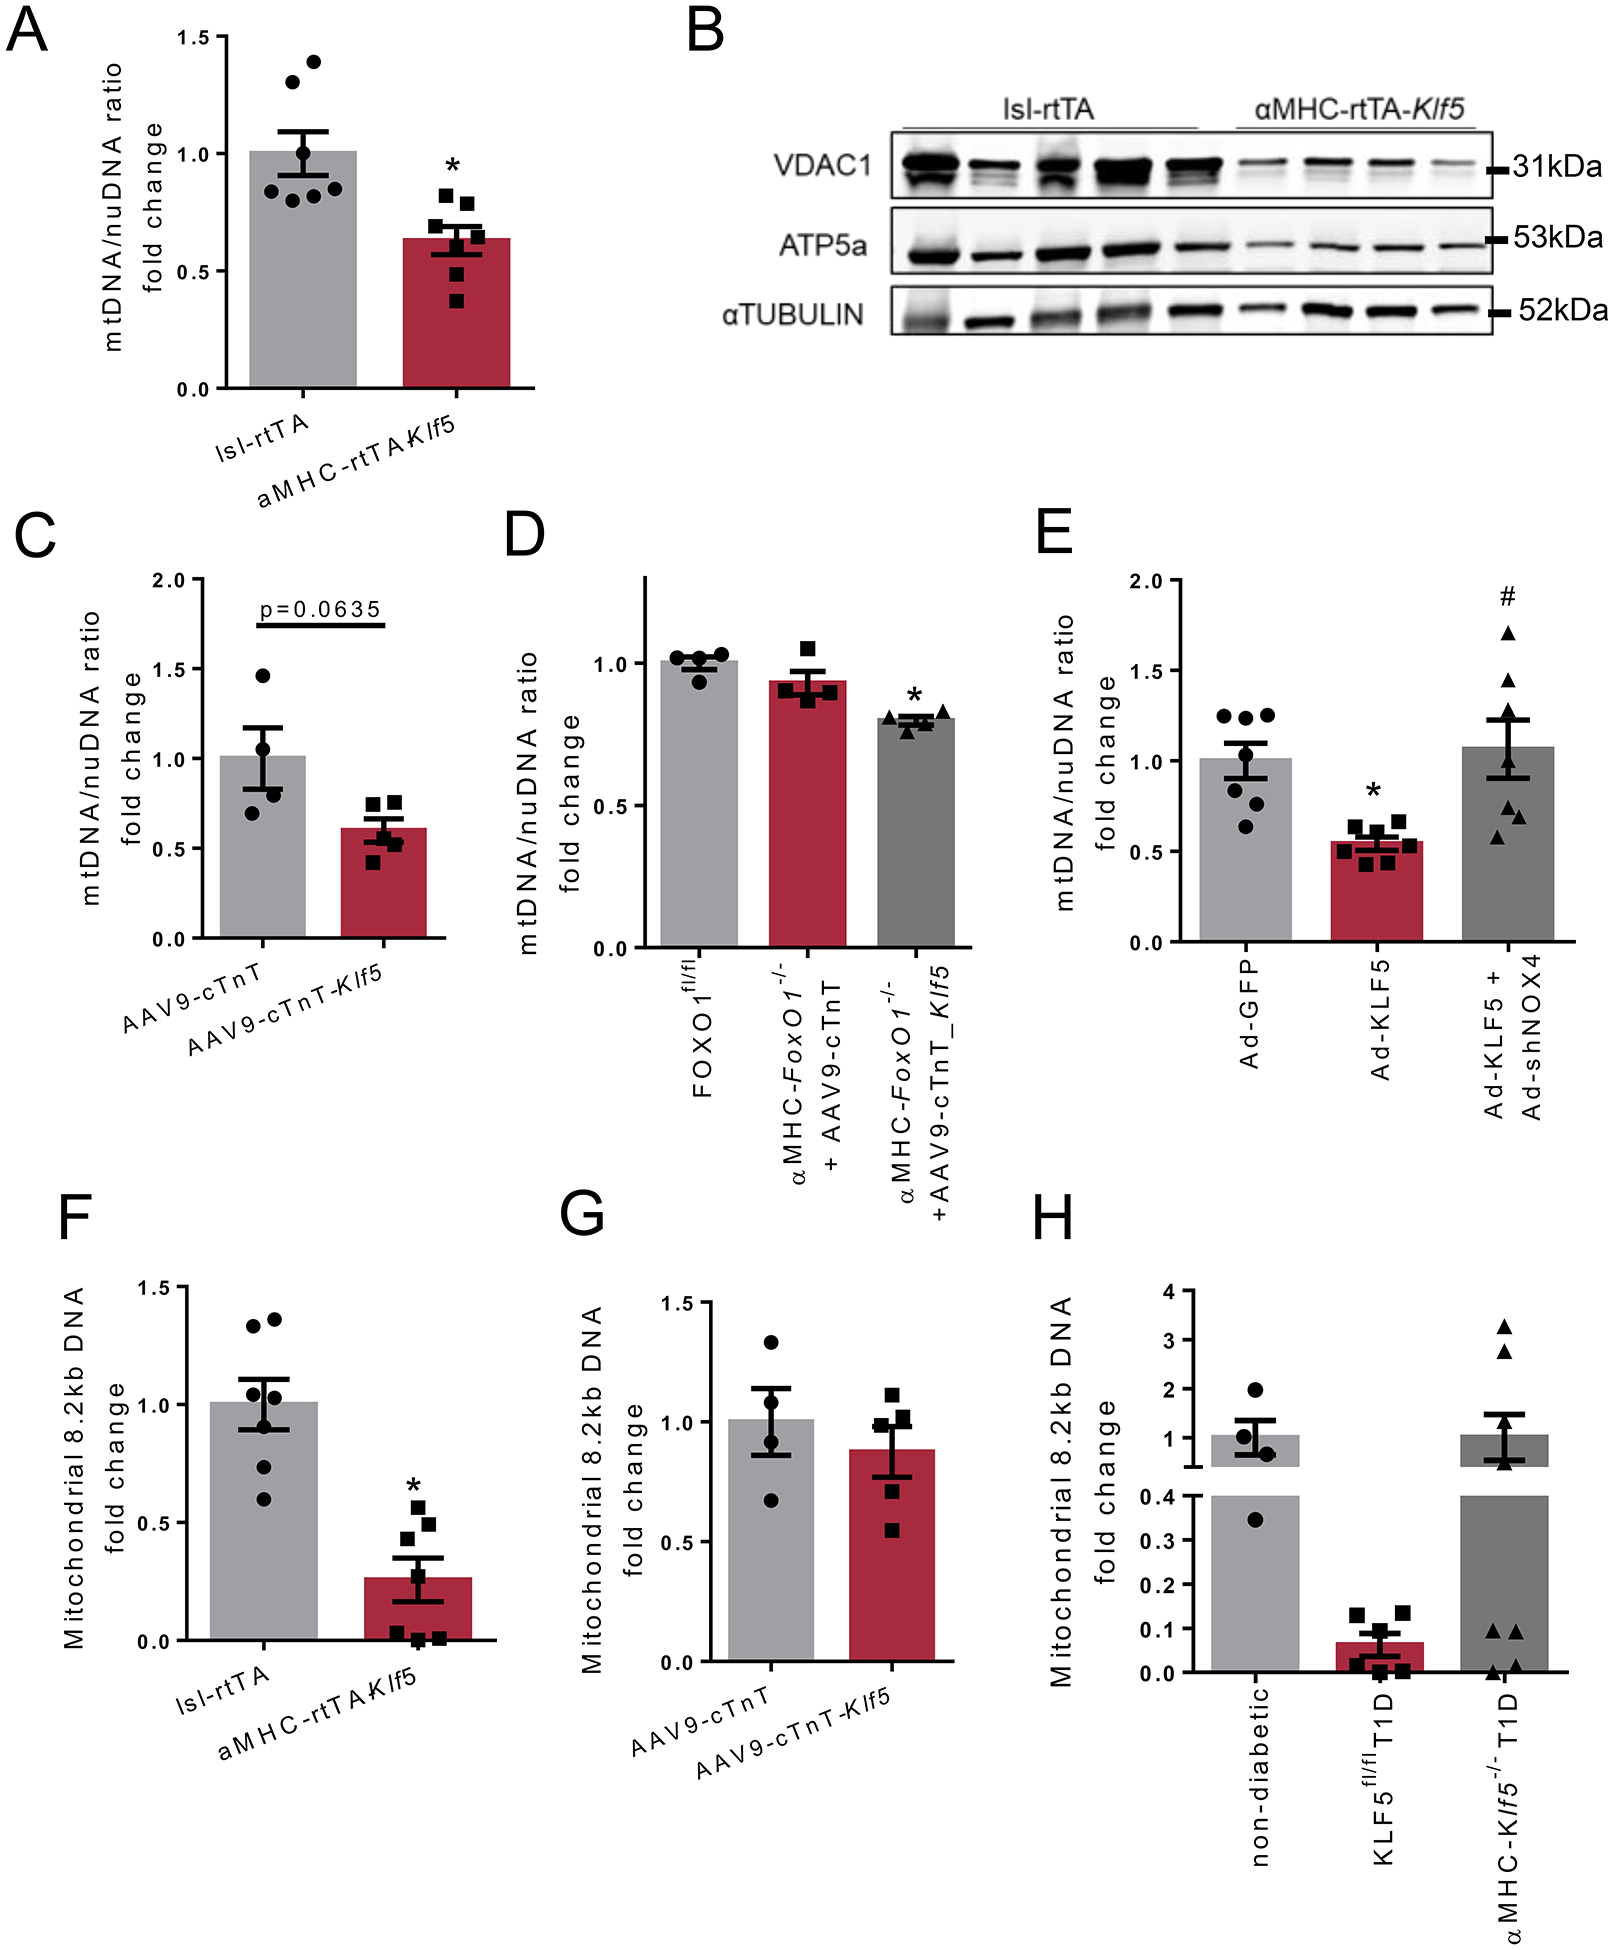
Fig. 7.

A: Mitochondrial DNA/nuclear DNA ratio in cardiac tissue of lsl-rtTA-TRE-Klf5 and αMHC-rtTA-Klf5 mice fed on doxycycline-enriched diet for 10 days. B: Immunoblots of cardiac VDAC1, ATP5a and α-TUBULIN in lsl-rtTA-TRE-Klf5 and αMHC-rtTA-Klf5 mice fed on doxycycline-enriched diet for 10 days (analysis shown in Online Figures XXXVII–H,I). C-E: Mitochondrial DNA/nuclear DNA ratio in cardiac tissue of C57BL/6 mice infected with AAV9-cTnT or AAV9-cTnT-hKlf5 (C), diabetic FOXO1fl/fl mice and diabetic αMHC-FoxO1−/− mice infected with AAV9-cTnT or AAV9-cTnT-hKlf5 (D), AC16 cells infected with adenovirus expressing GFP, KLF5 or KLF5+shNOX4 (E). F-H: Amplification of mitochondrial 8.2kb DNA sequence normalized to mitochondrial abundance of lsl-rtTA-TRE-Klf5 and αMHC-rtTA-Klf5 mice fed on doxycycline-enriched diet for 10 days (F), C57BL/6 mice infected with AAV9-cTnT or AAV9-cTnT-hKlf5 (G), and non-diabetic C57BL/6, diabetic KLF5fl/fl and diabetic αMHC-Klf5−/− mice (H).
