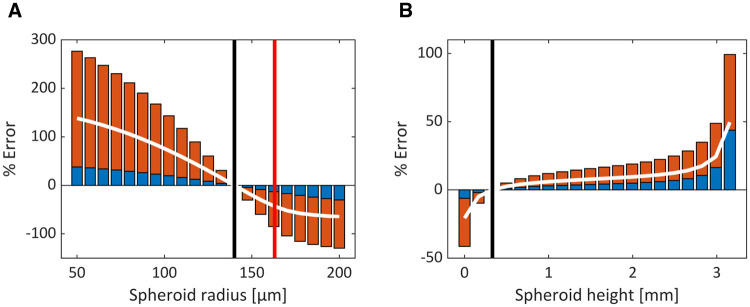
Fig 5. Sensitivity analysis of the optimised parameters.
The % error for both minimum (red) and maximum (blue) oxygen concentrations within the spheroid are plotted for variations in spheroid radius (A) and height within the well (B). White lines indicate averaged % error; black lines indicate the optimal conditions; and the red line indicates the hypoxic threshold.

