Fig. 1.

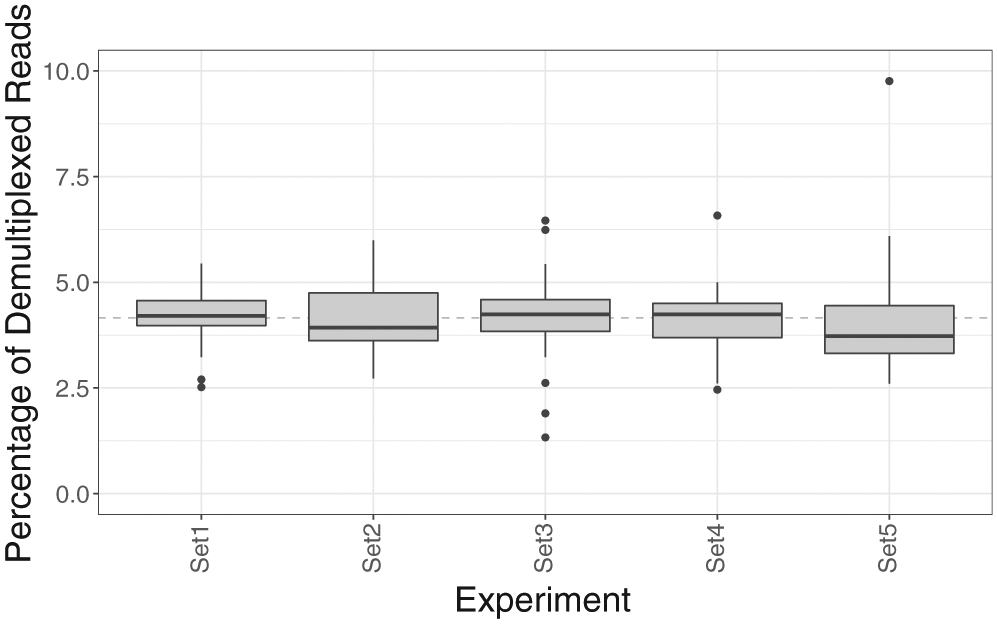
Distribution of reads per sample for the five MinION experiments. The dashed line represents the expected representation of a sample if all 24 samples in an experiment are equally represented.

Distribution of reads per sample for the five MinION experiments. The dashed line represents the expected representation of a sample if all 24 samples in an experiment are equally represented.