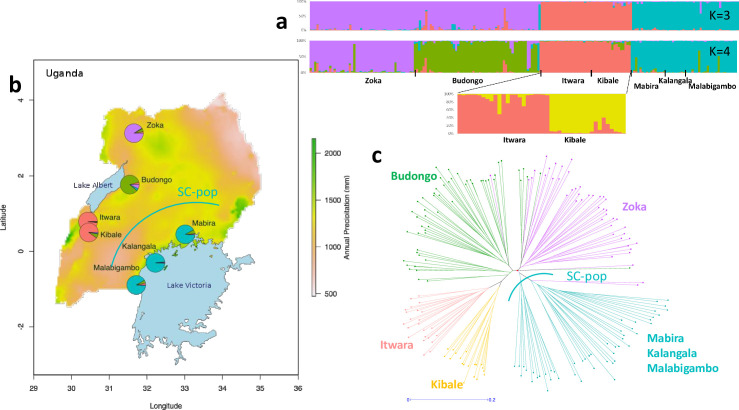
Fig 2. Genetic structure of Ugandan C. canephora native populations.
a- Percentage membership of the 191 wild accessions to each of K = 3 or 4 population clusters as inferred by STRUCTURE based on 19 SSR loci. The substructure is presented below for Itwara and Kibale individuals with K = 2 sub-clusters. b- Geographical distribution on the Ugandan map with the annual precipitation variable (BIO12) of SSR genetic groups considered according to the STRUCTURE analysis at K = 4. Each location is depicted as a pie chart with the proportional membership of its alleles to each one of the four groups with colours according to graph a. c- Unrooted dendrogram produced using the unweighted neighbour-joining method based on genetic dissimilarity among the 191 accessions. The branch colours indicate accessions corresponding to the five clusters from the population structure analysis, as in a-. Individuals from Mabira, Kalangala and Malabigambo forests are intermixed within a same large southern-central population (SC-pop).

