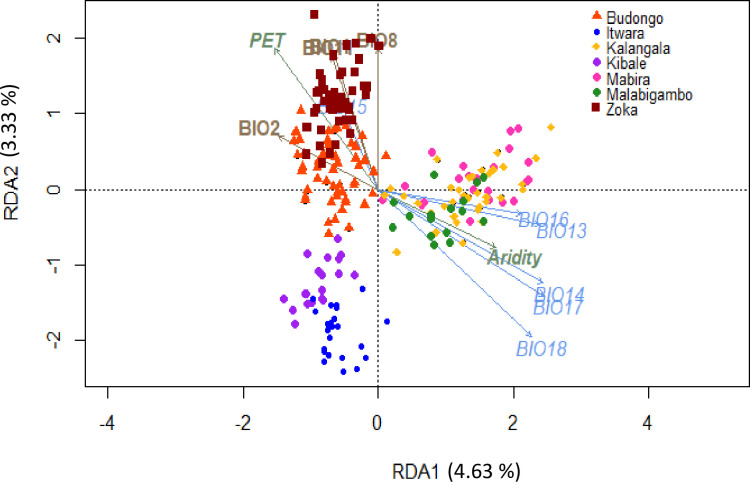
Fig 4. Constrained redundancy analysis (RDA) of the effects of environmental parameters on the allelic diversity of Ugandan C. canephora wild populations.
Twelve out of the 22 environmental variables used in this study significantly and collectively explained 16.3% of the total variation in allelic diversity. Colour codes are the same as in Fig 1. The first and second constraining axes explained 4.63% and 3.33% of the total genetic diversity, respectively.

