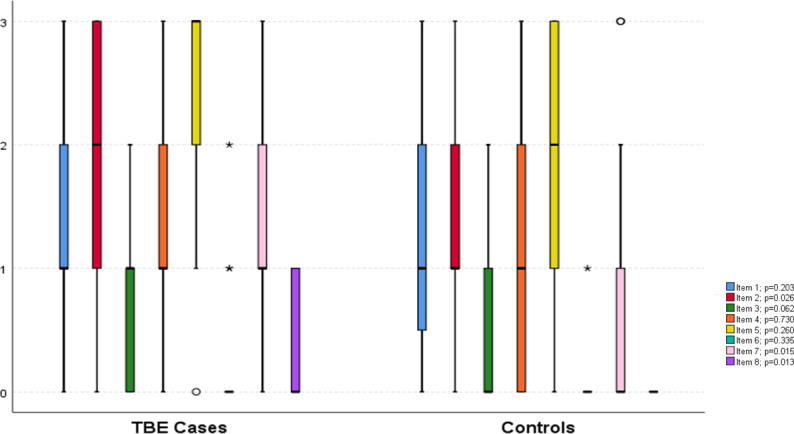
Fig 2. Comparison of the Epworth Sleepiness Scale items among the cases and controls.

Box and whiskers plot where the lines show median and interquartile ranges, whiskers show minimum and maximum values, circles depict outliers, stars extreme outliers. The questions refer to chance of dozing off during different situations: Item 1, while sitting and reading; Item 2, while watching TV; Item 3, while sitting inactive in a public place (e.g. theatre or a meeting); Item 4, as a passenger in a car for an hour without a break; Item 5, while lying down to rest in the afternoon when circumstances permit; Item 6, while sitting and talking to someone, Item 7, while sitting quietly after a lunch without alcohol; Item 8, in a car, while stopped for a few minutes in the traffic. 0 refers to “never”, 1 to “slight chance”, 2 to “moderate chance”, and 3 to “high chance” of dozing off.
