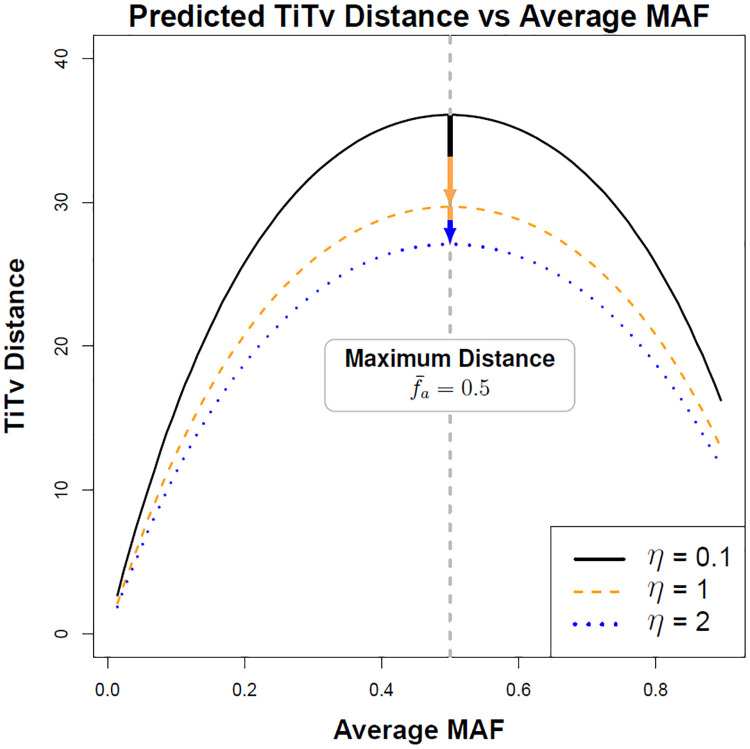
Fig 6. Predicted average TiTv distance as a function of average minor allele frequency (see Eq 142).
Success probabilities fa are drawn from a sliding window interval from 0.01 to 0.9 in increments of about 0.009 and m = p = 100. For η = 0.1, where η is the Ti/Tv ratio given by Eq 126, Tv is ten times more likely than Ti and results in larger distance. Increasing to η = 1, Tv and Ti are equally likely and the distance is lower. In line with real data for η = 2, Tv is half as likely as Ti so the distances are relatively small.

