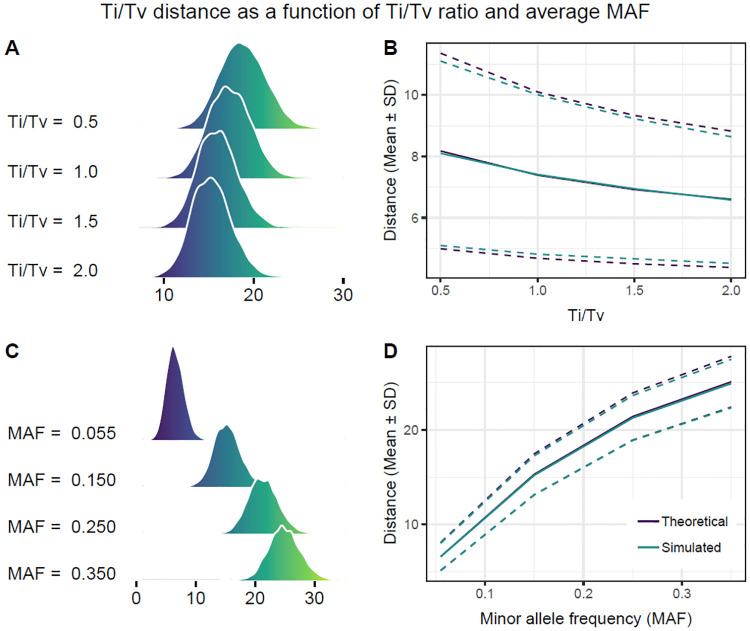
Fig 7. Density curves and moments of TiTv distance as a function of average MAF , given by Eq 142, and Ti/Tv ratio η, given by Eq 127.
We fix m = p = 100 for all simulated TiTv distances. (A) For fixed , TiTv distance density is plotted as a function of increasing η. TiTv distance decreases as η increases. For η = Ti/Tv = 0.5, there are twice as many transversions as there are transitions. On the other hand, η = Ti/Tv = 2 indicates that there are half as many transversions as transitions. Since transversions encode a larger magnitude distance than transitions, this behavior is expected. (B) Simulated and predicted mean ± SD are shown as a function of increasing Ti/Tv ratio η. Distance decreases as Ti/Tv increases. Theoretical and simulated moments are approximately the same. (C) For fixed η = 2, TiTv distance density is plotted as a function of increasing . TiTv distance increases as approaches maximum of 0.5, which means that there is about the same frequency of minor alleles as major alleles. (D) Simulated and predicted mean ± SD as a function of increasing average MAF . Distance increases as the number of minor alleles increases. Theoretical and simulated moments are approximately the same.

