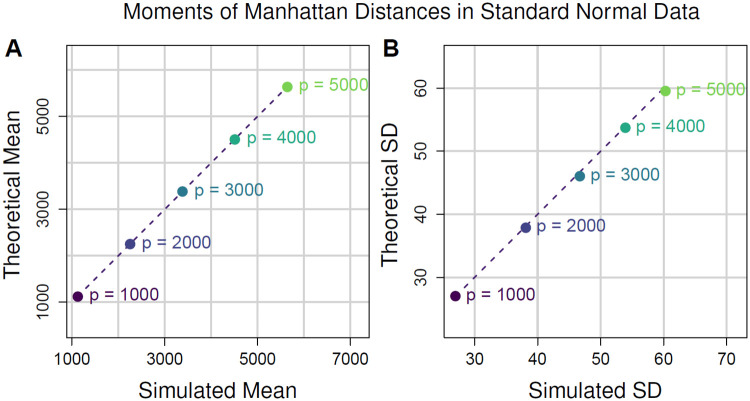
Fig 11. Comparison of theoretical and sample moments of Manhattan (Eq 1) distances in standard normal data.
(A) Scatter plot of theoretical vs simulated mean Manhattan distance (Eq 41). Each point represents a different number of attributes p. For each value of p we fixed m = 100 and generated 20 distance matrices from standard normal data and computed the average simulated pairwise distance from the 20 iterations. The corresponding theoretical mean was then computed for each value of p for comparison. The dashed line represents the identity (or y = x) line for reference. (B) Scatter plot of theoretical vs simulated standard deviation of Manhattan (Eq 1) distance (Eq 42). These standard deviations come from the same random distance matrices for which mean distance was computed for A. Both theoretical mean and standard deviation approximate the simulated moments quite well.

