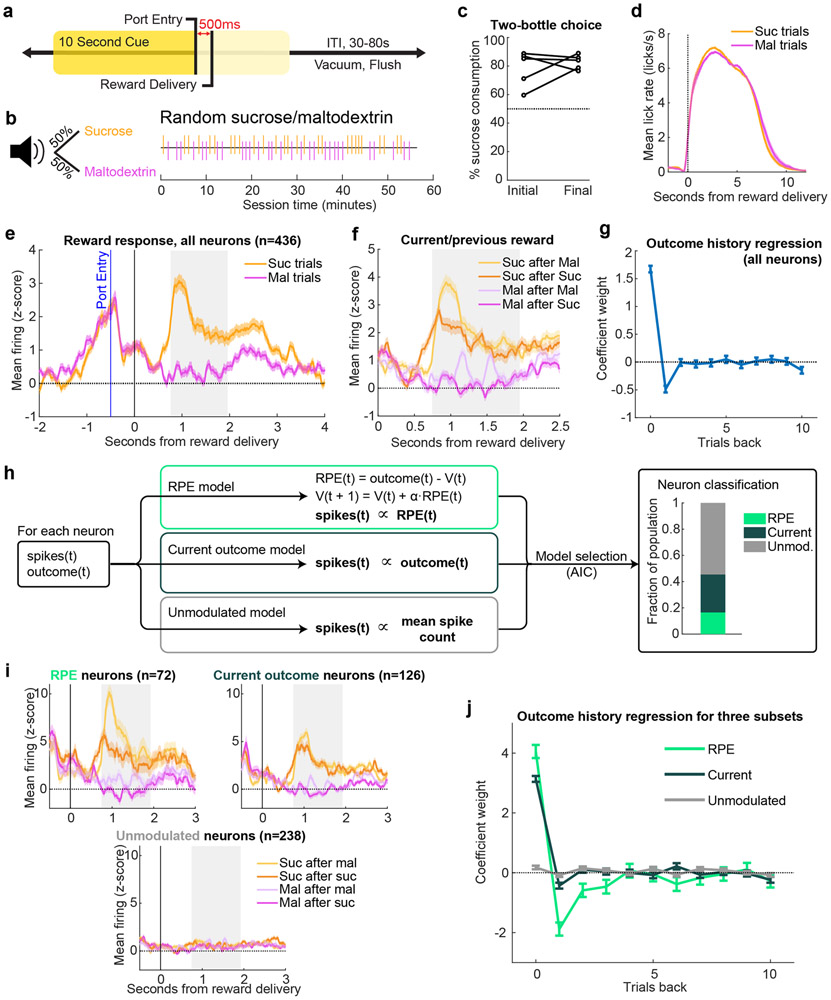
Figure 1. A subset of ventral pallidum neurons signal preference-based reward prediction errors.
(a, c-f) are adapted from (9). (a) Task: entering the reward port during a 10s cue triggered reward delivery. (b) The cue indicated 50/50 probability of receiving sucrose or maltodextrin solutions, as seen in example session (right). (c) Percentage sucrose of total solution consumption in a two-bottle choice, before (“Initial”) and after (“Final”) recording. (d) Mean(+/−SEM) lick rate relative to pump onset. (e) Mean(+/−SEM) activity of all recorded neurons on sucrose (Suc) and maltodextrin (Mal) trials.Gray rectangle indicates window used for analysis in (g-h,j) and all equivalent analyses in subsequent figures. (f) Mean(+/−SEM) activity of all recorded neurons on trials sorted by previous and current outcome. (g) Coefficients(+/−SE) from a linear regression fit to the z-scored activity of all neurons (n=436 neurons) and the outcomes on the current and preceding 10 trials. (h) Schematic of model-fitting and neuron classification process. For each neuron, the reward outcome and spike count following reward delivery on each trial were used to fit three models: RPE, Current outcome, and Unmodulated. Akaike information criterion (AIC) was used to select which model best fit each neuron’s activity (right). (i) Mean(+/−SEM) activity of neurons best fit by each of the three models, plotted according to previous and current outcome. (j) Coefficients(+/−SE) for outcome history linear regression for each class of neurons (n=72 RPE, 126 Current outcome, and 238 Unmodulated neurons).

