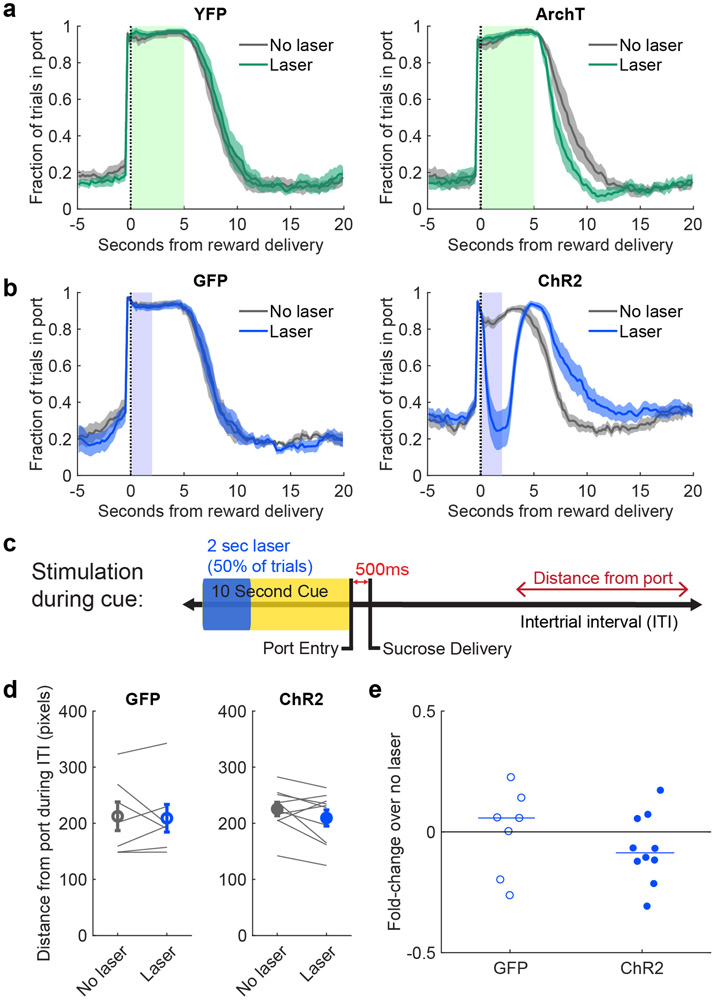
Extended Data Figure 4. Supplemental optogenetic data.
(a) Mean(+/−SEM) port occupancy in time surrounding reward delivery on laser and no laser trials for YFP (left, n=7 rats) and ArchT (right, n=7 rats) groups. (b) Mean(+/−SEM) port occupancy in time surrounding reward delivery on laser and no laser trials for GFP (left, n=7 rats) and ChR2 (right, n=11 rats) groups. To account for the disruption of port occupancy by laser stimulation, we ran our distance from port analysis on the time beyond 15s past reward delivery and found the same pattern of results. (c) Additional optogenetic experiment in ChR2 rats and controls where the 2 sec of laser stimulation was at the onset of the cue. (d) Mean(+/−SEM) distance from port in the ITI following laser stimulation did not differ from no laser trials for GFP (p = 0.94, Wilcoxon signed-rank test, two-sided, n=7 rats) or ChR2 (p = 0.11, Wilcoxon signed-rank test, two-sided, n=10 rats) groups. (e) The effect of laser was similar across both groups (median: 0.06 GFP, n=7 rats; −0.09 ChR2, n=10 rats; p = 0.36, Wilcoxon rank-sum test, two-sided).

