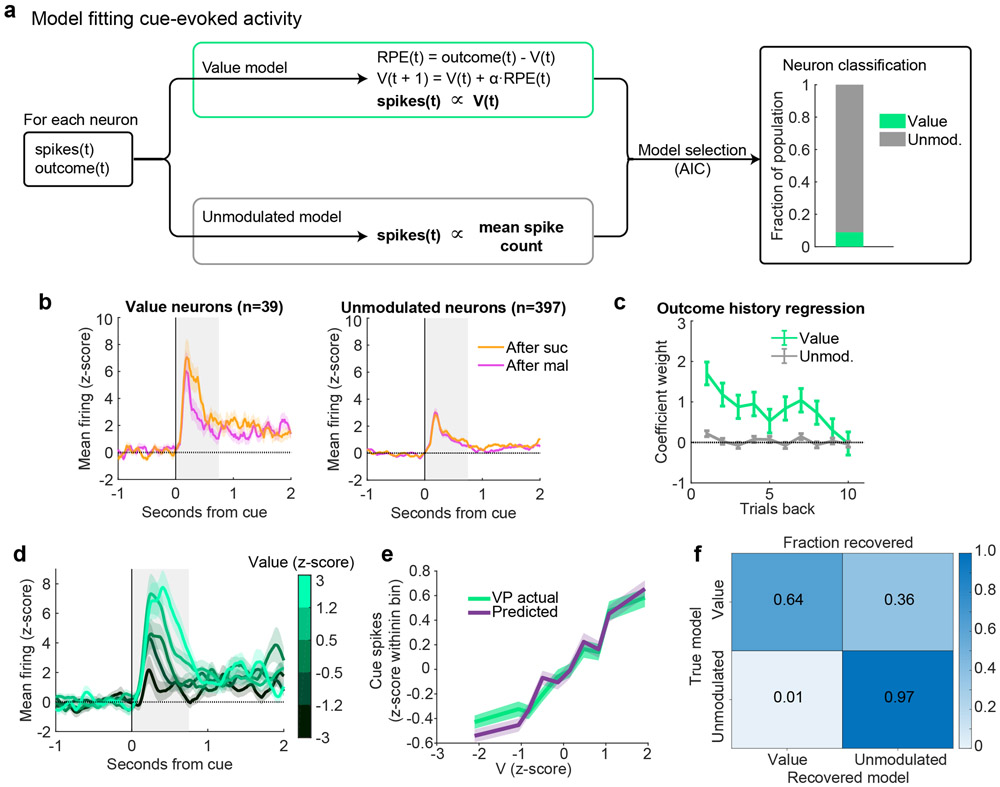
Extended Data Figure 5. Value encoding in VP at the time of cue onset in the random sucrose/maltodextrin task.
(a) Schematic of model-fitting and neuron classification process. For each neuron, the reward outcome and spike count following reward delivery on each trial were used to fit two models: Value and Unmodulated. Akaike information criterion (AIC) was used to select which model best fit each VP neuron’s activity (right). (b) Mean(+/−SEM) activity of neurons best fit by each of the models, plotted according to previous outcome. (c) Coefficients(+/−SE) for outcome history linear regression for each class of neurons (n=39 Value and 397 Unmodulated neurons). (d) Mean(+/−SEM) activity of all Value neurons with trials binned by model-derived Value. (e) Mean(+/−SEM) population activity of simulated and actual Value neurons according to each trial’s Value (V). (f) Model recovery, plotted as the fraction of neurons simulated with each model recovered as that model.

