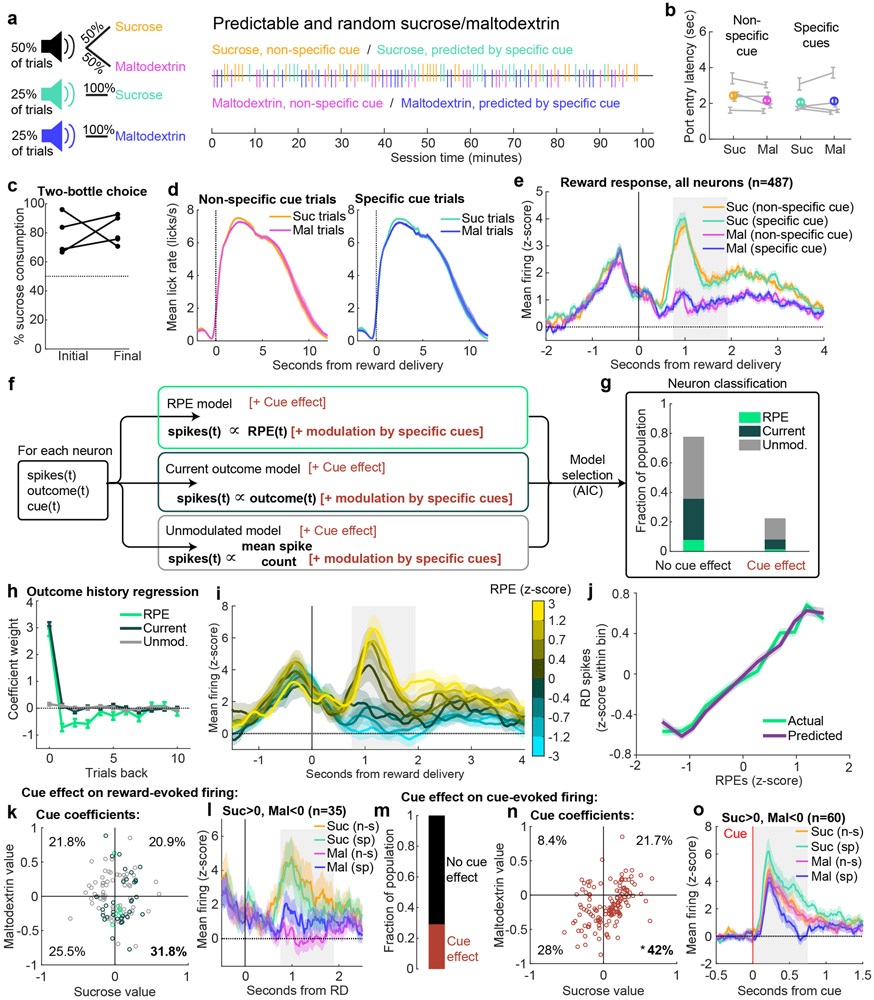
Extended Data Figure 8. Cue-derived and outcome history-derived predictions separately impact VP firing.
(a) Three distinct auditory cues indicated three trial types: a 50/50 probability of receiving sucrose or maltodextrin solutions, a 100% probability of receiving sucrose, or a 100% probability of receiving maltodextrin, as seen in the example session (right). (b) Median latency to enter reward port following onset of cue for each trial type, plotted as the mean(+/−SEM) across all sessions for each rat (gray lines, n=8, 9, 10, and 10 sessions for the 4 rats) and the overall mean(+/−SEM) (n=37 sessions). (c) Percentage sucrose of total solution consumption in a two-bottle choice, before (“Initial”) and after (“Final”) recording. (d) Mean(+/−SEM) lick rate relative to pump onset for each trial type. (e) Mean(+/−SEM) activity of all neurons recorded in the predictable and random sucrose/maltodextrin task, aligned to reward delivery. (f) Schematic of cue model-fitting and neuron classification process. The reward outcome and spike count from each trial were used to fit six models: RPE, Current outcome, and Unmodulated with and without the cue effect, which allowed a different weight for the impact of each cue. Neurons were classified according to Akaike information criterion. (g) Fraction of the population best fit by each model. (h) Coefficients(+/−SE) for outcome history regression for each class of neurons with no cue effect (n=38 RPE, 135 Current outcome, and 204 Unmodulated neurons). (i) Mean(+/−SEM) activity of all RPE neurons with no cue effect (n=38 neurons). The trials for each neuron are binned according to their model-derived RPE. (j) Population activity of simulated and actual VP RPE neurons with no cue effect according to each trial’s RPE value. (k) Scatterplot of each cue effect neuron’s weight for specific sucrose and maltodextrin cues (n=7 RPE, 33 Current outcome, and 70 Unmodulated cells with cue effects). The percentage of neurons falling in each quadrant is indicated. The percentage in our quadrant of interest (bottom right, positive value for sucrose and negative value for maltodextrin) did not differ from chance (p > 0.09 for exact binomial test compared to null of 25%). (l) Mean(+/−SEM) activity of neurons with sucrose values > 0 and maltodextrin values < 0, consistent with a value-based cued expectation modulation. (m) Neurons with cue effects for cue-evoked signaling, rather than reward-evoked signaling, as in (g). (n) As in (k), for activity at the time of the cue rather than time of reward (n=143 neurons with cue effects). * = p < 0.0001 for exact binomial test compared to null of 25%. (o) As in (l), for activity at the time of the cue rather than time of reward.

