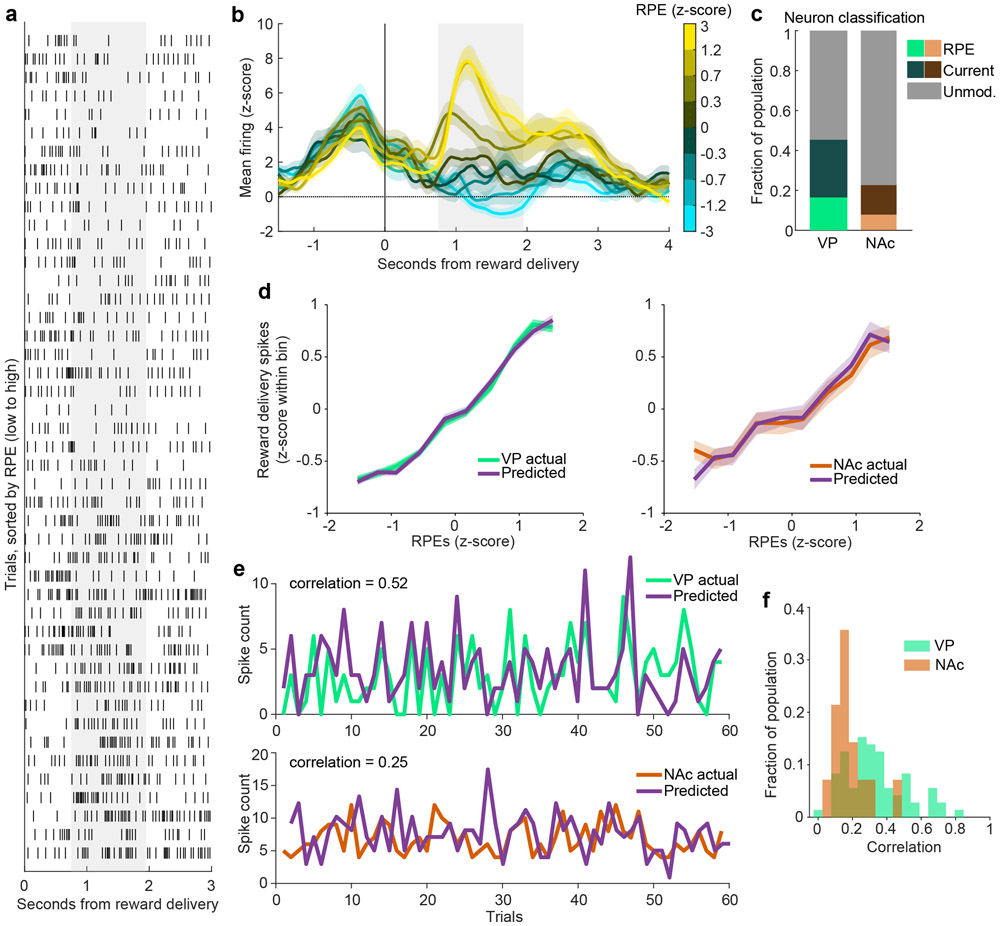
Figure 2. RPE encoding is more prevalent and robust in VP than in NAc.
(a) Raster of an individual VP neuron’s spikes on each trial, aligned to reward delivery, and sorted by the model-derived RPE value for each trial. Gray shaded region indicates window used for analysis. (b) Population mean(+/−SEM) of all VP RPE neurons identified in Fig. 1. The trials for each neuron are binned according to their model-derived RPE. (c) Proportion of the population in VP and NAc classified as RPE, Current outcome, or Unmodulated. There were fewer RPE cells in NAc than in VP (8% versus 17%, χ2 = 8.3, p = 0.004) and Current outcome cells (14% in NAc versus 29% in VP, χ2 = 13.6, p = 0.0002). (d) Mean(+/−SEM) population activity of simulated and actual RPE neurons according to each trial’s RPE value for VP (top) and NAc (bottom). (e) The model-predicted and actual spike counts on each trial for one RPE neuron each from VP (top) and NAc (bottom). These neurons were the 85th percentile for correlation for each respective region. (f) Distribution of correlations between model-predicted and actual spiking for all RPE neurons from each region.

