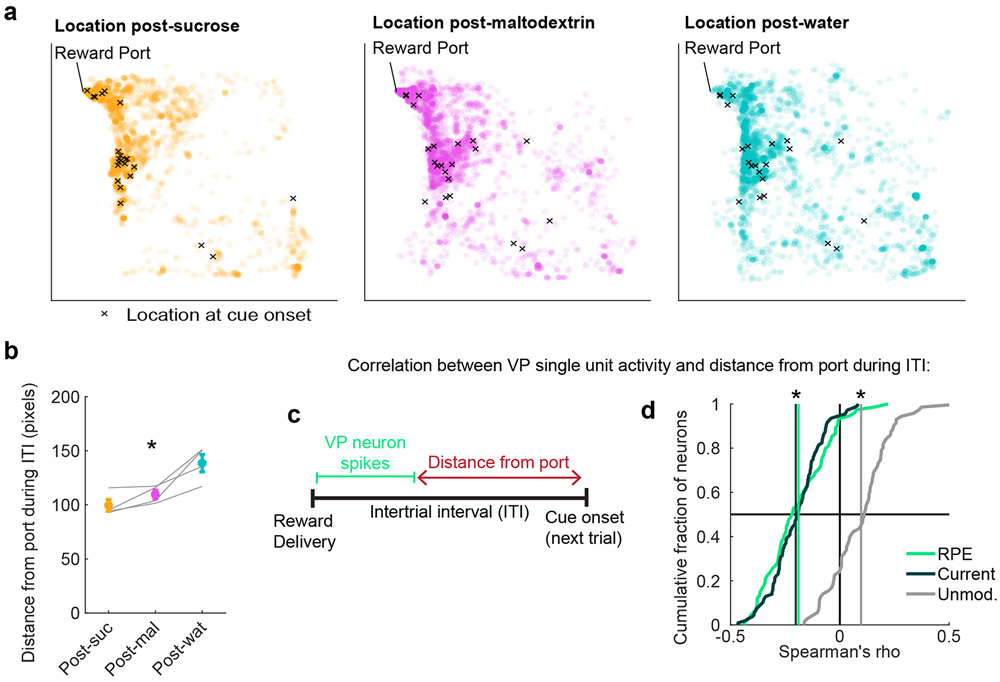
Figure 4. VP reward activity tracks changes in trial-by-trial task engagement.
(a) All locations of a rat from an example session during the intertrial interval (ITI) following sucrose (left), maltodextrin (center), and water (right) delivery. Each circle is one location during a 0.2s bin. X marks the location at cue onset for the subsequent trial. Chamber is 32.4cm x 32.4cm (approximately 306 x 306 pixels). (b) Mean(+/−SEM) distance from the port during ITI following sucrose (orange), maltodextrin (pink), and water (blue) trials during recording sessions (n=4 sessions from 3 rats). Gray lines represent mean for one subject in one session. * = ρ = −0.86, p = 0.0004, Spearman’s rank correlation coefficient between distance from port and reward preference ranking. (c) Approach for correlating the activity of individual VP cells with distance from the port on a trial-by-trial basis. (d) Distribution of correlations between individual VP neurons’ firing rates on each trial and the distance from the port during the subsequent ITI. * = significant shift in mean correlation coefficient (vertical lines) compared to 1000 shuffles of data for RPE (p = 8 * 10−10), Current outcome (p = 3 * 10−18), and Unmodulated neurons (p = 0.00008), Wilcoxon signed-rank test, two-sided.

