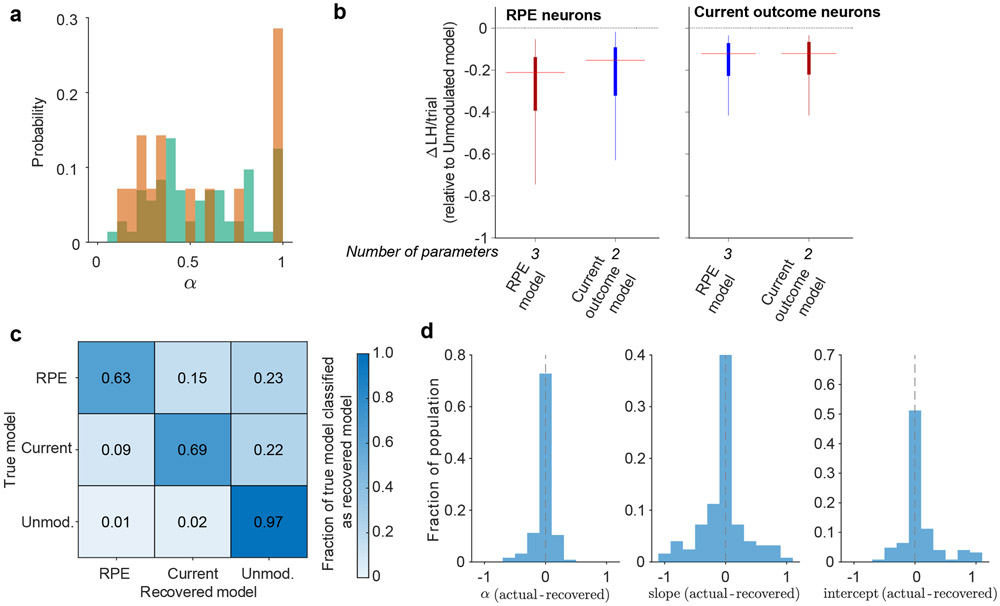
Extended Data Figure 2. Evaluation of model fitting.
(a) Distribution of the learning rate, α, for RPE neurons in VP (green) and NAc (orange). (b) Likelihood (LH) per trial for RPE (n=72) and Current outcome (n=126) neurons for RPE and Current outcome models, relative to the LH per trial of the Unmodulated model. Lower (more negative) indicates a better fit. Line represents median, box represents 25th and 75th percentile, and whiskers extend to 1.5 times the interquartile range. Red highlights the AIC-selected model. Median [25th to 75th percentile; min to max] ΔLH/trial are: RPE neurons, RPE model −0.21 [−0.39 to −0.14; −3.16 to −0.05], RPE neurons, Current outcome model −0.15 [−0.32 to −0.09; −3.03 to −0.02], Current outcome neurons, RPE model −0.12 [−0.23 to −0.07; −0.174 to −0.03], Current outcome neurons, Current outcome model −0.12 [−0.22 to −0.07; −1.73 to −0.03]. Median [25th-75th percentile] LH per trial for RPE neurons was 2.29 [2.04 to 2.49] and for Current outcome neurons was 2.15 [1.92 to 2.37]. (c) Model recovery, plotted as the fraction of neurons simulated with each model recovered as that model. (d) Distribution of difference between the true value of the parameters used to simulate the neurons in (c) and the values recovered by MLE.

