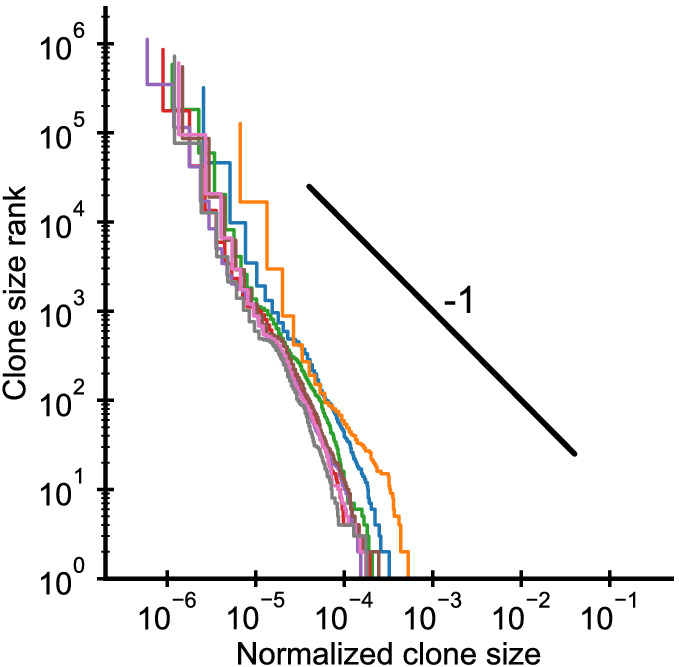
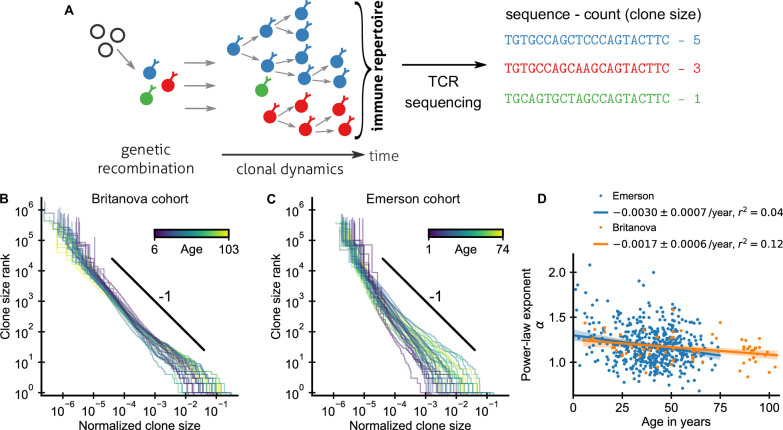
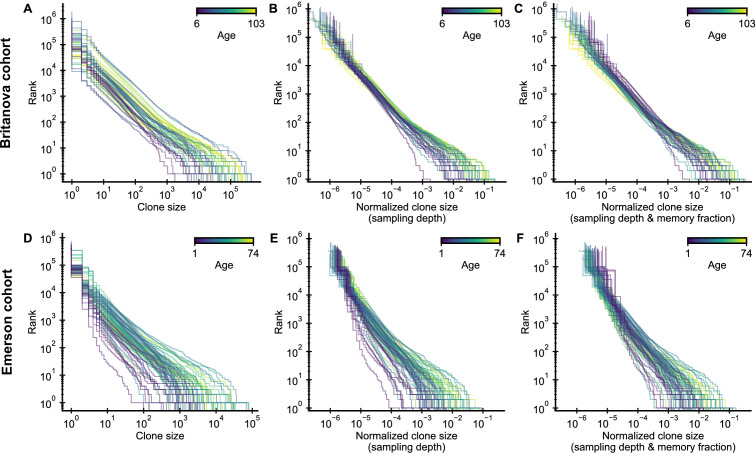
Figure 1. Statistics of human T cell repertoire organization.
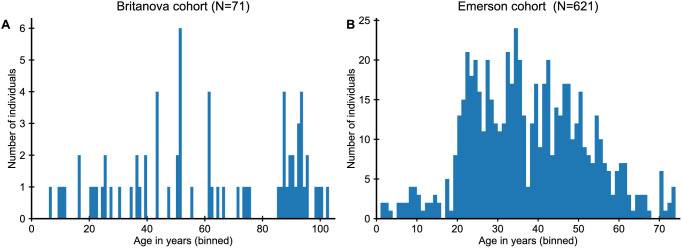
(A) T cells with highly diverse receptors are created from progenitor cells through genetic recombination (left), which then undergo clonal selection (middle) together shaping the immune repertoire. The T cell receptor (TCR) locus acts as a natural barcode for clonal lineages, which can be read out by sequencing (right). (B, C) Clone size distributions in two large cohort studies of human blood samples using disparate sequencing protocols display a power-law relationship between the rank and size of the largest clones. Each line shows the size distribution of all T cell clones in an individual in an unsorted blood sample, that is independently of the phenotypes of the cells making up the different clones. Ages are color coded as indicated in the legend. The black line shows a power law with a slope of -1 for visual comparison. Normalized clone sizes were defined as the number of reads of a given receptor’s sequence divided by the total number of reads within a sample and a factor equal to the average fraction of T cells with memory phenotype at different ages to account for variations in sampling depth and in the subset composition of peripheral blood, respectively (Figure 1—figure supplement 3). Only a single individual is displayed per 2-year age bracket to improve visibility. (D) Power-law exponents as a function of the age (legend: linear regression slope and coefficient of determination). Data sources: Britanova et al., 2016, Emerson et al., 2017.
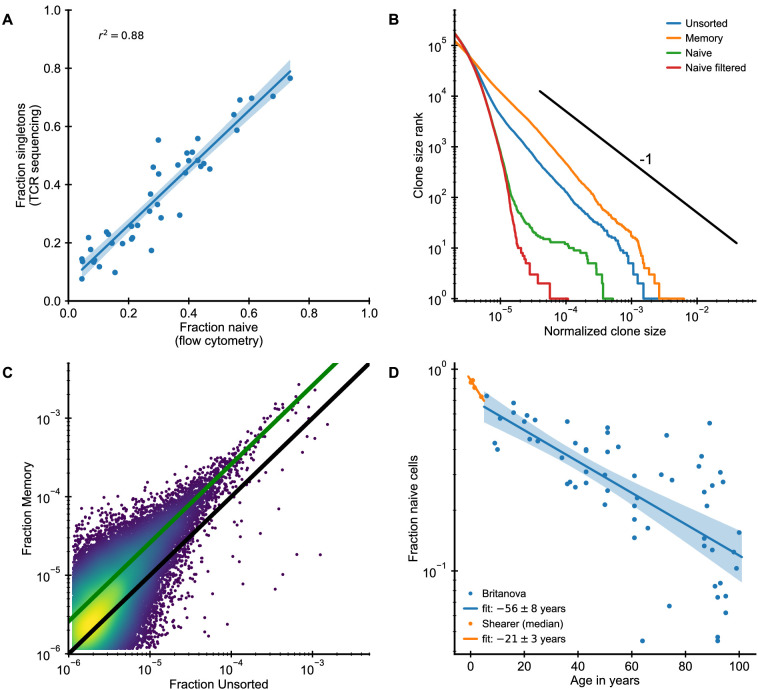
Figure 1—figure supplement 2. Clone size distributions in phenotypically sorted T cell subsets.
Figure 1—figure supplement 3. Influence of normalization procedure on clone size distributions.
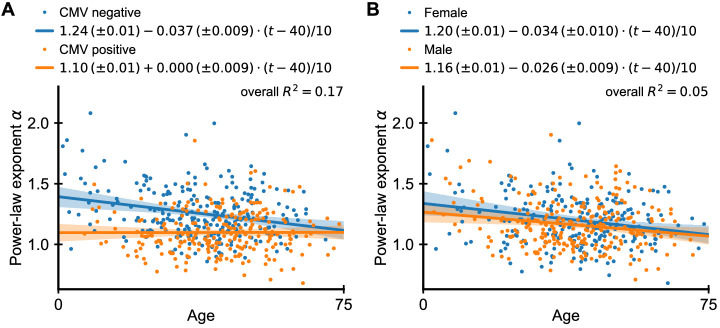
Figure 1—figure supplement 4. Dependence of power-law exponent on age by cytomegalovirus (CMV) infection status and sex.
Figure 1—figure supplement 5. Clone size distributions in cordblood.
