Figure 2. Emergence of power-law scaling of clone sizes in a minimal model of repertoire formation.
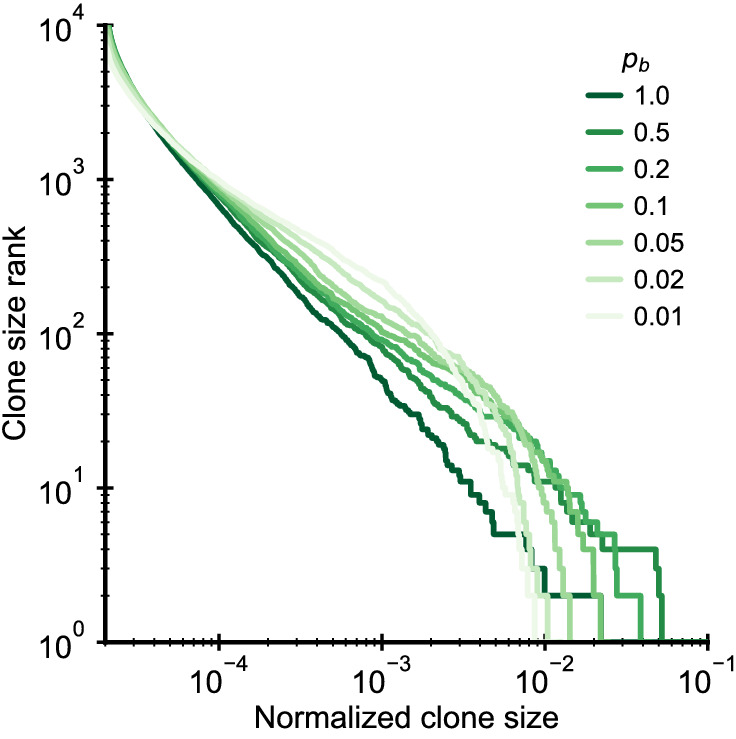
(A) Sketch of the stochastic dynamics of recruitment, proliferation, and death of T cells. Proliferation is inversely proportional to total repertoire size, which reflects increased competition as the repertoire grows. (B) Clone size distributions in simulated repertoires display power-law scaling (blue lines), in contrast to steady-state predictions that conform with those of a null model based only on demographic stochasticity (black line, Equation 48). (C) Illustration of the mechanism: early in life rates of proliferation exceed clonal turnover (lower panel). As the total repertoire size increases (gray line, upper panel) the proliferation rate decreases due to increased competition. The dynamics of selected clones after their recruitment marked by a dot is indicated by colored lines (upper panel). The line position shows the cumulative size of all prior clones, while the line width indicates the size of the clone (not to scale). The earlier a clones is recruited the larger it expands during the period of overall repertoire growth. (D) Dependence of the clone size distribution on parameters. Simulated repertoires at 5 years of age were subsampled to 106 cells to mimick the experimental sampling depth (solid lines). The simulated data closely follow predictions from a continuum theory of repertoire formation (dashed lines). Model parameters: (B,D) clonal death rate d = 0.2/year, clonal recruitment rate θ = 106/year, clone size at recruitment C0 = 1; (B) total proliferation rate b0 = 107/year (implying a recruitment to proliferation ratio γ = 0.1), (D) variable b0 as indicated in the legend by the ratio γ.

Figure 2—figure supplement 1. Analytical predictions for clone size distributions in a model with variable recruitment sizes.
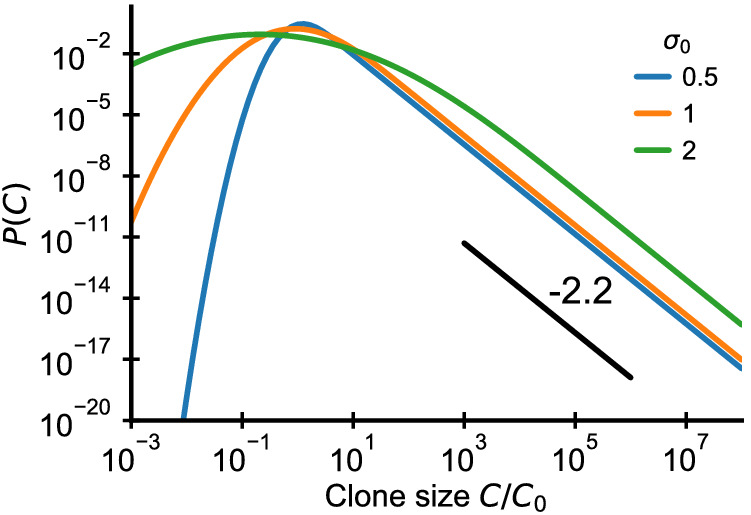
Figure 2—figure supplement 2. Simulated clone size distributions in a model with saturation of proliferation rates.
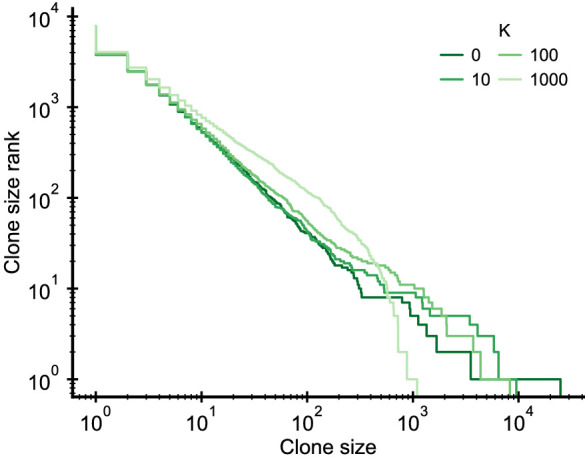
Figure 2—figure supplement 3. Simulated clone size distributions in a model with competition for clone-specific resources.