. 2021 Jan 12;10:e59755. doi: 10.7554/eLife.59755

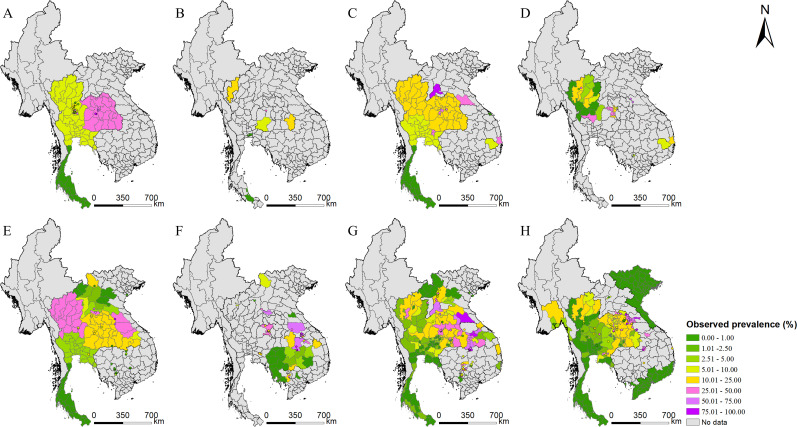
Figure 2. Survey locations and observed prevalence of O. viverrini infection in endemic countries of Southeast Asia.

(A) 1978–1982, (B) 1983–1987, (C) 1988–1992, (D) 1993–1997, (E) 1998–2002, (F) 2003–2007, (G) 2008–2012, and (H) 2013–2018.

Figure 2—source data 1. The original data of O. viverrini infection in endemic countries of Southeast Asia.
elife-59755-fig2-data1.xlsx (235.2KB, xlsx)
Figure 2—source data 2. The results of the preferential sampling test.

Figure 2.

Figure 2—figure supplement 1. Result of quality assessment of eligible studies.
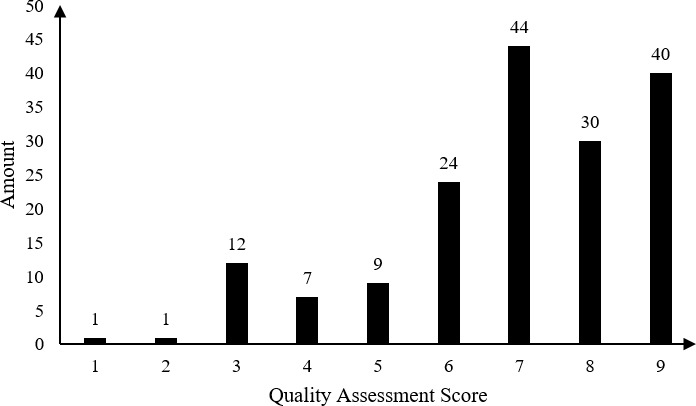
Figure 2—figure supplement 1.

Figure 2—figure supplement 1—source data 1. The results of quality assessment.