. 2021 Jan 12;10:e59755. doi: 10.7554/eLife.59755

Figure 3. Model-based estimated risk maps of O. viverrini infection in endemic countries of Southeast Asia in different years.

Estimated prevalence based on the median of the posterior estimated distribution of infection risk in (A) 1978, (B) 1983, (C) 1988, (D) 1993, (E) 1998, (F) 2003, (G) 2008, (H) 2013, and (I) 2018.

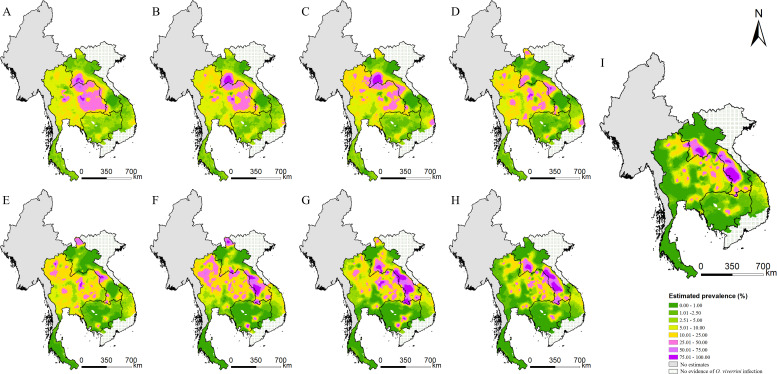
Figure 3—source data 1. The sensitivity analysis results of model-based estimated risk maps in 2018.

Figure 3.

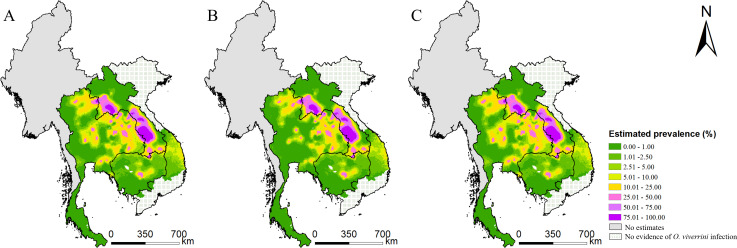
Figure 3—figure supplement 1. Model-based estimated risk maps of O. viverrini infection in 2018 under different values assigned to prevalence for surveys only reported prevalence in intervals.

Figure 3—figure supplement 1.

(A) The midpoint values of the intervals, (B) the lower limits, and (C) the upper limits of the intervals were assigned to prevalence.
Figure 3—figure supplement 1—source data 1. Sensitivity analysis for surveys reported prevalence in intervals.