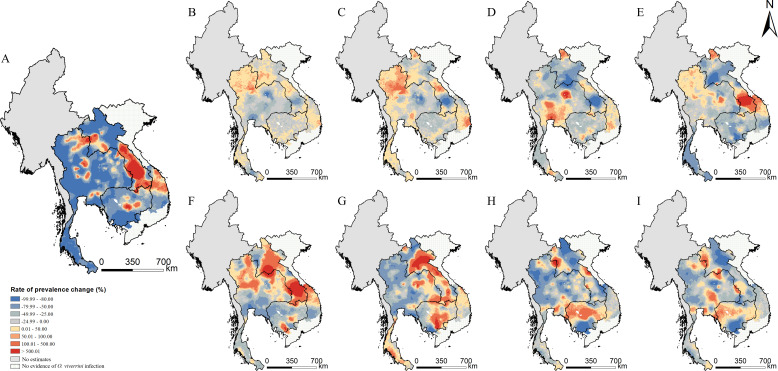
Figure 5. Changes of O. viverrini infection risk across time periods.
Changes were calculated by the median of the posterior estimated distribution of infection risk for the latter time period minus that for the former time period divided by that for the former time period. The risk changes (A) between 1978 and 2018; (B) between 1978 and 1983; (C) between 1983 and 1988; (D) between 1988 and 1993; (E) between 1993 and 1998; (F) between 1998 and 2003; (G) between 2003 and 2008; (H) between 2008 and 2013; and (I) between 2013 and 2018 (source data: Figure 5—source data 1).

