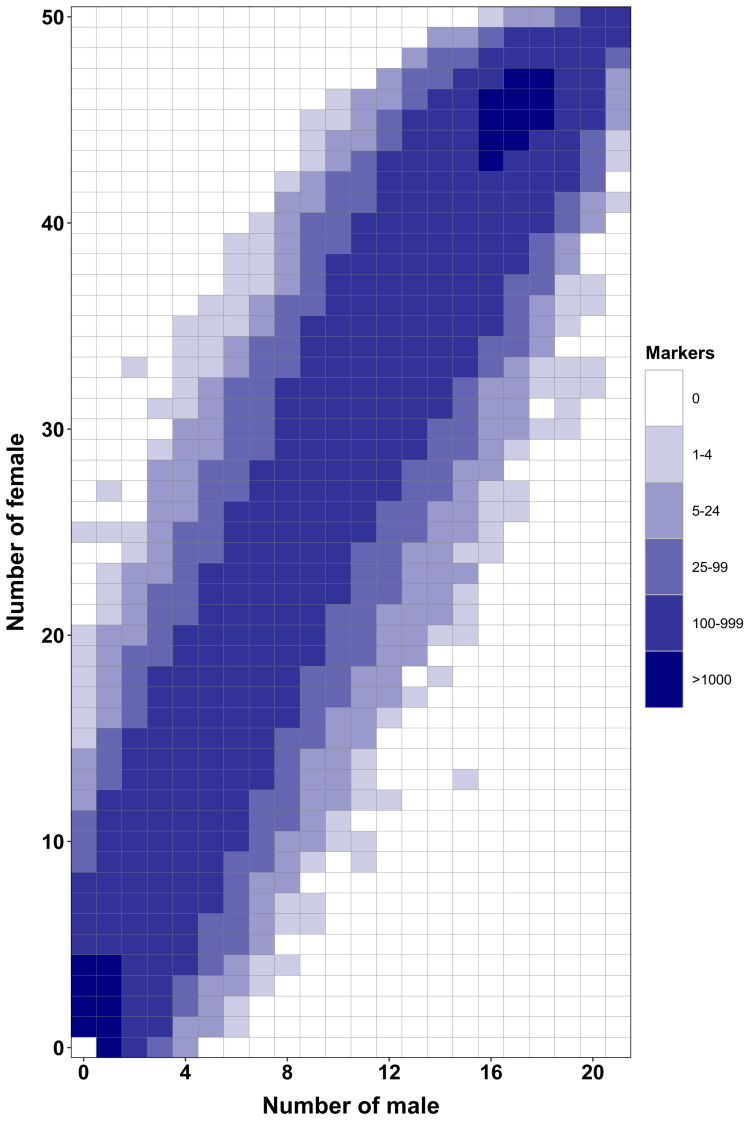
Appendix 1—figure 5. RAD-Seq analysis in a second Esox masquinongy population from Quebec (Canada) supports the lack of sex-specific marker in this population.
Each tile plot shows the distribution of non-polymorphic RAD-Seq markers between phenotypic males (horizontal axis) and phenotypic females (vertical axis). The intensity of color for a tile corresponds to the number of markers present in the respective number of males and females. No tiles for which the association with phenotypic sex is significant (chi-square test, p<0.05 after Bonferroni correction) were detected in this analysis. RAD-Seq reads data and samples information are found under NCBI bioproject PRJNA512459.

