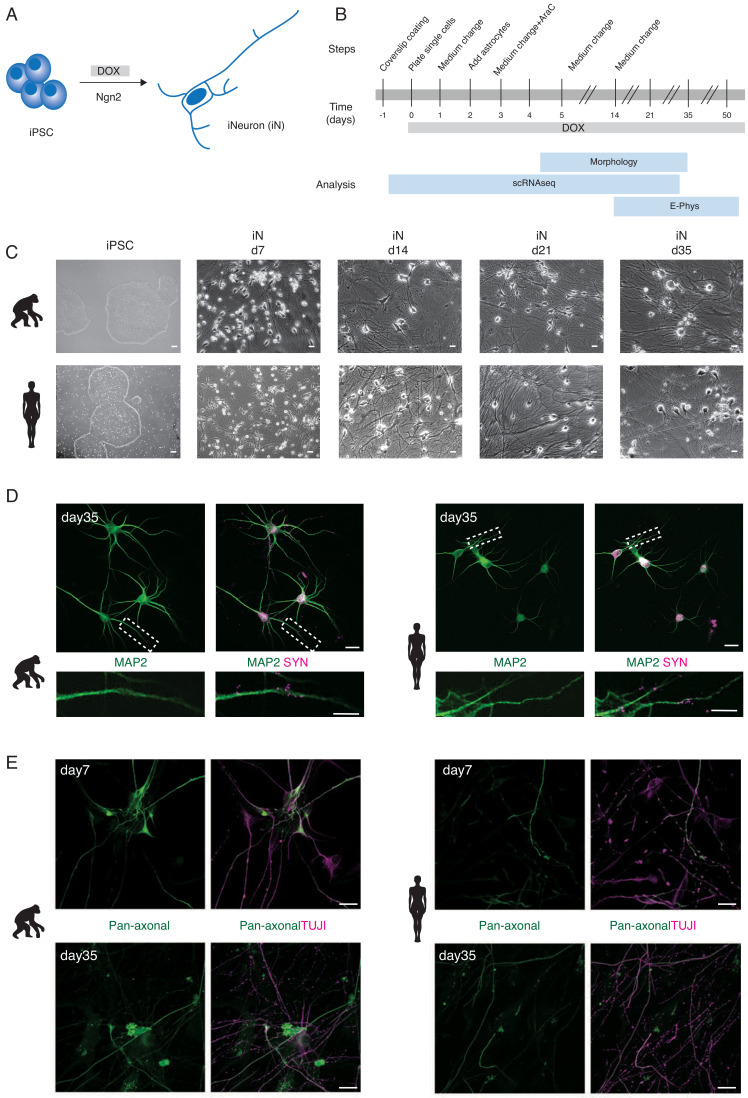
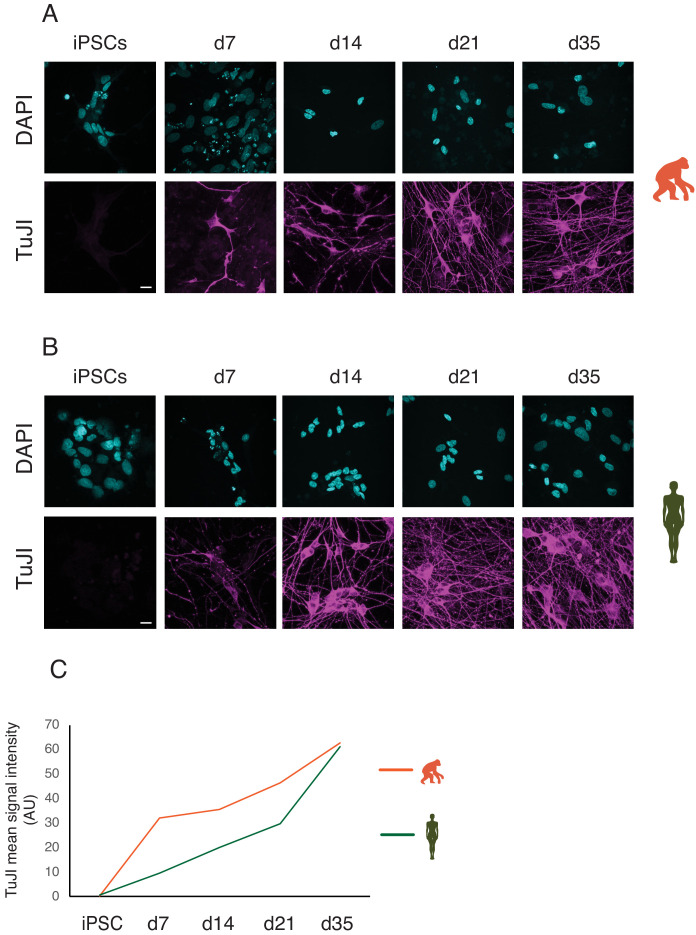
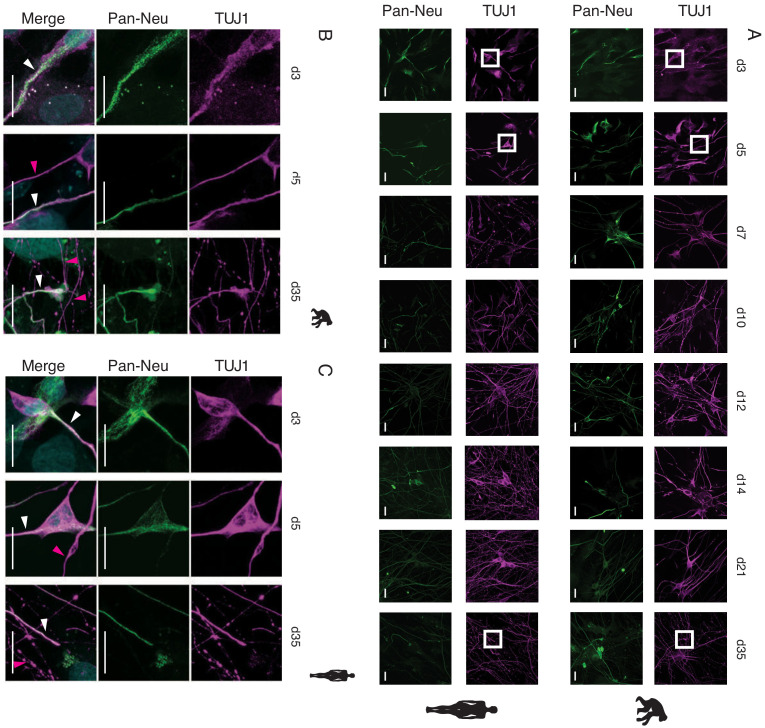
Figure 1. Generation of human and ape iNs.
NGN2-induced iNs generated from human and ape pluripotent stem cells (A, B) differentiate into mature neurons and express neuronal markers (C, D, E). (A) iNs are generated from iPSCs/ESCs upon DOX-induced overexpression of mouse NGN2. (B) Schematic of the experimental pipeline for iNs structural and functional analysis at different time points. The expression of NGN2 was induced at d0 by adding DOX to the culture medium. iNs were either collected for single-cell RNA sequencing (scRNAseq), used for electrophysiological recordings (E-phys), or fixed for morphological analysis (morphology). Single-cell RNA sequencing (scRNAseq) was performed for one chimpanzee (SandraA) and three human (409B2, SC102A1, and H9) cell lines, electrophysiology was performed using all eight cell lines and morphological analyses were done with two chimpanzee (SandraA and JoC), the bonobo (BmRNA), and three human (409B2, SC102A1, and H9) cell lines. (C) Phase-contrast images of iPSCs and iNs maturation for chimpanzee (SandraA) and human (409B2) lines. Scale bars are 10 µm. (D) Mature chimpanzee (SandraA) and human (409B2) iNs express the cytoskeletal marker MAP2 (green) and the pre-synaptic marker SYN1 (magenta). Top: low-magnification view. Scale bars are 20 µm. Bottom: high-magnification view, showing SYN1 puncta in juxtaposition with a MAP2-positive neurite. Scale bars are 10 µm. (E) Distribution of TUJI (TUJI, magenta) and an axonal marker (pan-neurofilament antibody, abbreviated as Pan-Neu, green) in d7 and d35 iNs. Scale bars are 20 µm. We will refer to ape iNs for results where we combined chimpanzee and bonobo iNs for analysis.


