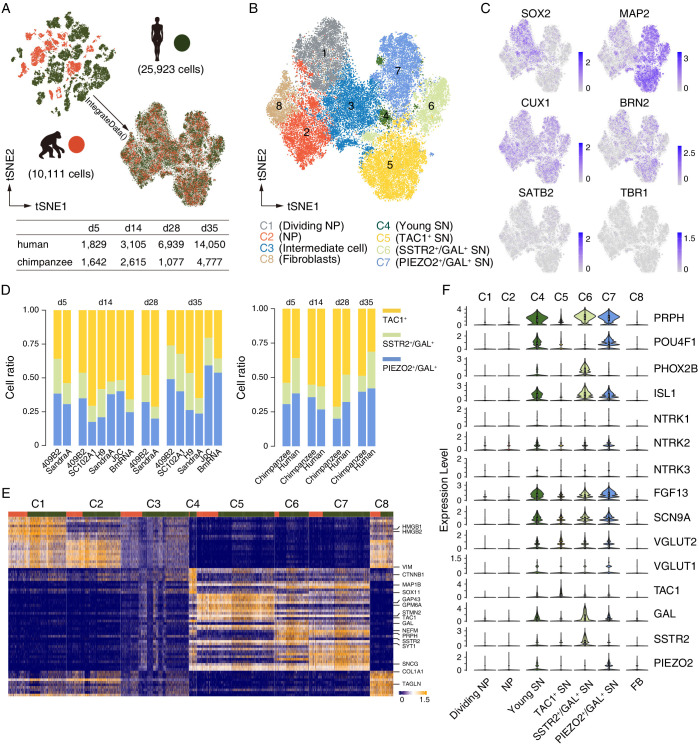
Figure 3. scRNAseq analysis reveals that Nng2-induced iNs are sensory neurons.
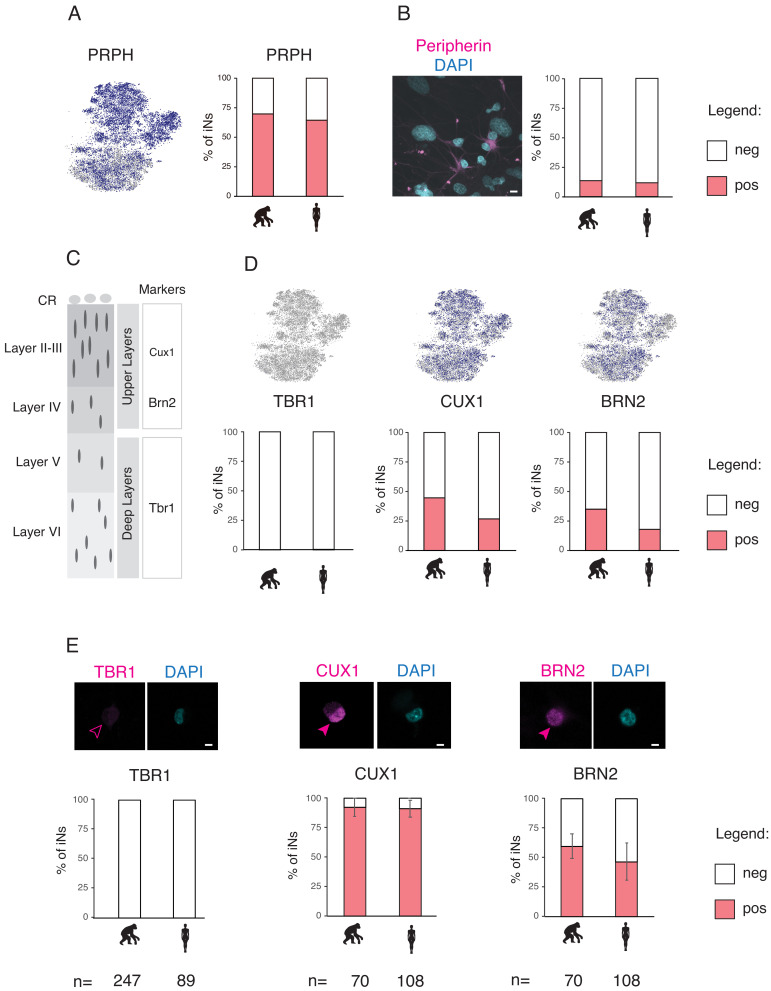
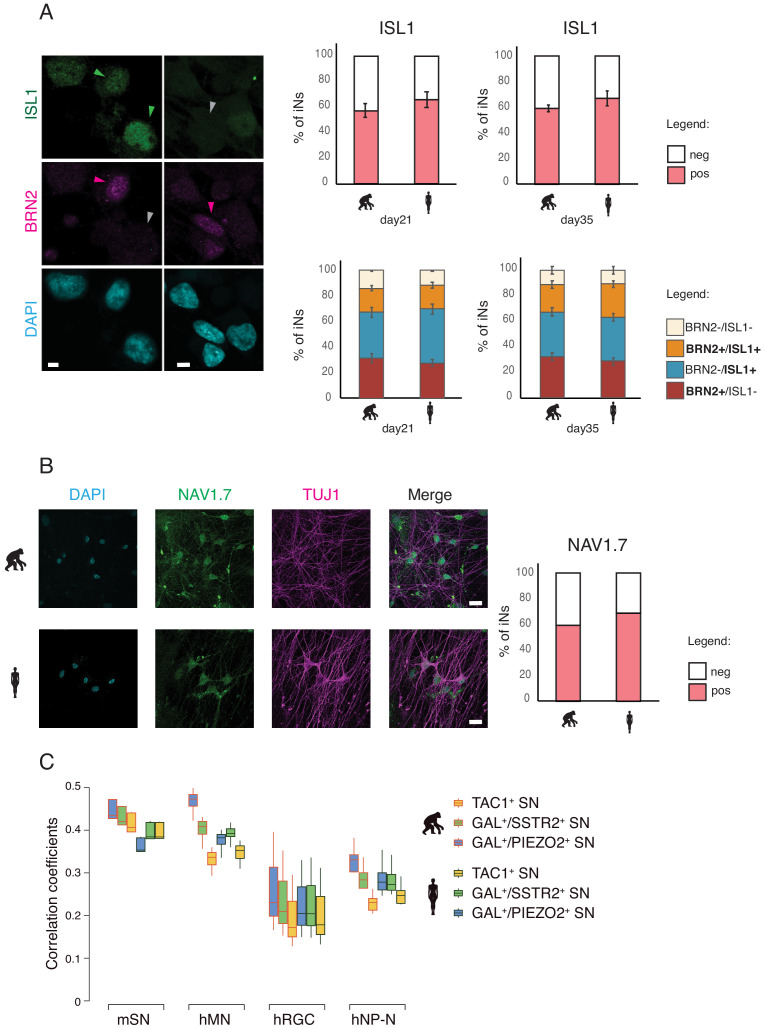
Cell identity and heterogeneity were assessed using tSNE combined for all time points for ape (orange) and human (green) cells. (A) Filtered cell number for ape and human cells at different time points. (B) Identification of 8 different cell clusters by marker gene expression. NP, neural progenitor; SN, sensory neuron. (C) Marker gene expression (blue) for progenitor cells (SOX2), mature neurons (MAP2), and cortical cells (CUX1, BRN2, SATB2, and TRB1). Scale bars: uncorrected normalized expression. (D) Cell ratios of the three neuronal sub-classes of TAC1 (yellow), SSTR2 and GAL (green), and PIEZO and GAL (blue) expressing neurons for all cell lines and species. TAC1+, SSTR2+/GAL+, and PIEZO2+/GAL+ neurons on d5: 54%/36% (chimpanzees/humans), 16%/26%, and 31%/38; TAC1+, SSTR2+/GAL+, and PIEZO2+/GAL+ neurons on d14: 55%/57%, 9%/17%, and 36%/27%; TAC1+, SSTR2+/GAL+, and PIEZO2+/GAL+ neurons on d28: 71%/48%, 9%/20%, and 20%/32%; TAC1+, SSTR2+/GAL+, and PIEZO2+/GAL+ neurons on d35: 49%/31%, 12%/27%, and 40%/42%. (E) Heatmap showing scaled expression levels of top 10 significantly higher expressed genes in seven cell populations in iNs culture. The main populations we identified are fibroblasts (FB), neural progenitors, and neurons. Top annotation bars: ape (orange) and human (green). (F) The expression levels of sensory neurons markers are shown as a violin plot for neural progenitor’s clusters C1 and C2 and for neuron’s clusters C4, C5, C6, and C7. Note that the POU homeodomain transcription factors BRN3A (POU4F1) and Islet1 (ISL1) are highly expressed in a subset of early iNs. All iN clusters show high expression of growth factor FGF13 and voltage-gated sodium channel Nav1.7 (SCN9A) that regulate mechano-heat sensation in vivo.

