. 2021 Jan 11;10:e63450. doi: 10.7554/eLife.63450

Figure 2. Matching 15 transcriptomic clusters to specific projection neuron (PN) types at 24 hr APF.

(A) Representative maximum z-projection of confocal stacks of split#28 GAL4 in adults. Dendrites of split#28 GAL4+ PNs target the DC3 and DA4l glomeruli. (B) Diagram of split#28-GAL4+ PNs. (C) tSNE plot showing newly sequenced split#28-GAL4+ PNs, which form two clusters that can be assigned to DC3 and DA4l PNs (see also Figure 2—figure supplement 1). (D) Representative confocal images of split#7 GAL4 labeled PNs using permanent labeling strategy. One anterior section and one posterior section of the antennal lobe are shown. Using permanent labeling, we found that this driver is expressed in eight PN types. Genotype: split#7-GAL4, UAS-Flp, Actin promoter-FRT-STOP-FRT-GAL4, UAS-mCD8-GFP. (E) Diagram of split#7-GAL4+ PNs. split#7 GAL4 labels eight types of PNs. four from the adPN lineage (green letters) and four from the lPN lineage (red letters). (F) tSNE plot of split#7 GAL4 PNs with GH146+ PNs (see Figure 2—figure supplement 2 for details on the decoding procedure). (G) Representative maximum z-projection of confocal stacks of kn+ PNs in the adult. kn-GAL4 was intersected with GH146-Flp to restrict the expression of GAL4 in only PNs. (H) Representative confocal images of split#15 GAL4 in adults, which labels two kn+ PN types. (I) Diagram showing that kn+ PNs include six types of adPNs and two vPNs. (J) tSNE plot of kn-GAL4 PNs with GH146+ PNs (see Figure 2—figure supplement 3 for details on the decoding procedure). (K) Dot plot summarizing drivers and marker genes we used to map 21 transcriptomic clusters to 20 PN types [14 adPNs, 5 lPNs—DA1 PNs form two clusters, one fru+ and one fru– (Li et al., 2017)—and 1 vPNs] and the anterior paired lateral (APL) neurons at 24 hr APF. Gene expression level [log2(CPM+1)] is shown by the dot color, and percentages of cells expressing a marker are shown by dot size. (L) tSNE plot showing 24 hr APF PNs colored by PN types (GH146+ PNs with split#7+/ split#28 PNs to increase cell number in some less abundant PN types). Scale bars, 20 μm. Axes, D (dorsal), L (lateral). In panel B, E, and I, orange glomeruli represent PN types of unknown transcriptomic identity prior to this study. Green glomeruli represent PN types whose transcriptomic identity were previously decoded. Note that the positions of cells on a tSNE plot are dependent on the random initialization of the program as well as every cell present in the dataset, therefore the position of GH146+ PNs clusters are different when we plot them with different set of newly sequenced PNs (gray in panels C, F, and J).

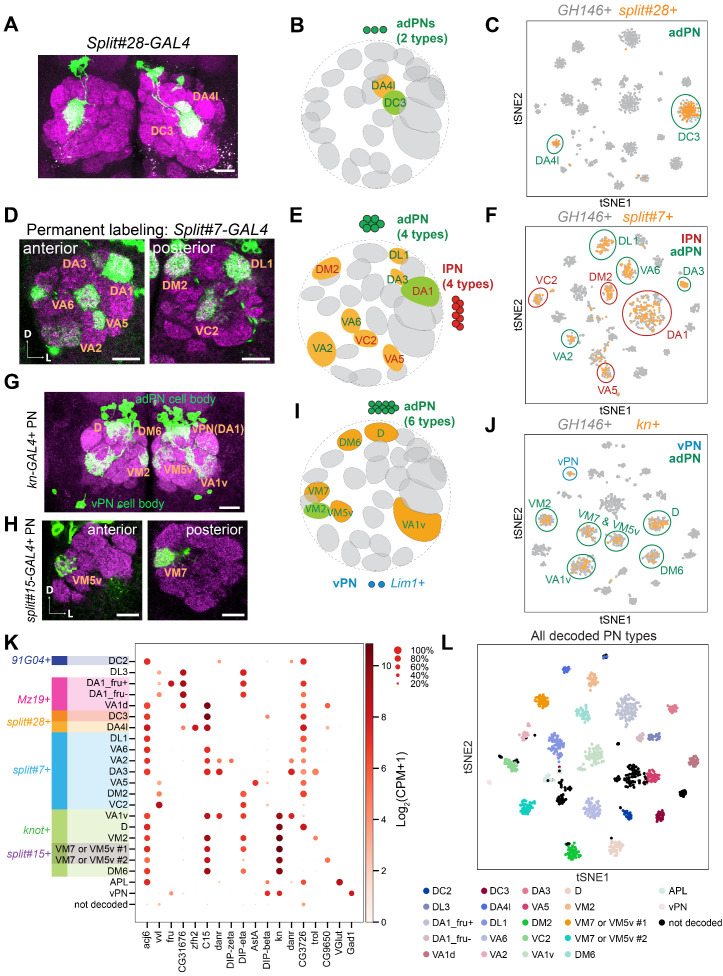
Figure 2.

Figure 2—figure supplement 1. Validation of DA4l projection neuron (PN) identity.

Figure 2—figure supplement 1.

(A) Visualization of GH146+ and split#28-GAL4+ PNs using tSNE. Cells are colored according to driver genotypes (left) or by the expression of zfh2 (right). (B) zfh2-GAL4, after intersecting with GH146-Flp, labels DA4l PNs. Scale bars, 20 μm. Axes, D (dorsal), L (lateral).
Figure 2—figure supplement 2. Decoding the identity of split#7+ projection neurons (PNs).

Figure 2—figure supplement 2.

(A) Representative confocal images of split#7+ PNs. Without permanent labeling, this driver is strongly expressed in three PN types in adults. Permanent labeling showed that it can label eight adult PN types (Figure 2D), suggesting that this driver is expressed in eight PN types during development and turned off in five of them in adult stage. (B) Visualization of GH146+ and split#7+ PNs colored according to genotype (left), acj6 (middle), and CG31676 (right) expression. Previously, we know among those split#7+ PNs, the cells with CG31676 expression are DA1 PNs (Li et al., 2017). (C) Among split#7+ adPN clusters (circled in green), only one cluster does not express C15. Intersection between C15-p65AD and the GAL4 DNA-binding domain (DBD) from split#7 (top) as well as intersection between C15-GAL4DBD and the p65-activating domain (AD) from split#7 (bottom) revealed that the C15-negative cluster represents DL1 PNs. (D) Among split#7+ adPNs (circled in green), two clusters are danr–. One of those cluster represents DL1 PNs. Intersection between danr-p65AD and VT033006-GAL4DBD (split-GAL4 with PN specific expression) revealed the other danr– adPN is VA6 PNs. (E) One split#7+ cluster specifically expresses DIP-zeta. Intersection between DIP-zeta-GAL4 and GH146-Flp revealed this cluster represents VA2 PNs. As three out of four adPN clusters are assigned, we assigned the last unassigned to be DA3 PNs. (F) Among split#7+ lPNs (circled in red), only one cluster is DIP-eta-. Intersection between DIP-eta-GAL4 and GH146-Flp revealed the identity of this cluster as VA5 PNs. (G) The DIP-eta– cluster also specifically expresses AstA. Intersection between AstA-GAL4 and GH146-Flp labels VA5 PNs, further confirming its identity. (H) Among the last two unmapped clusters, one is DIP-beta+. Intersection between DIP-beta-GAL4 and GH146-Flp revealed the cluster negative for DIP-beta is DM2 PNs. And we assigned the remaining split#7+ lPN cluster to be VC2 PNs. Scale bars, 20 μm. Axes, D (dorsal), L (lateral).
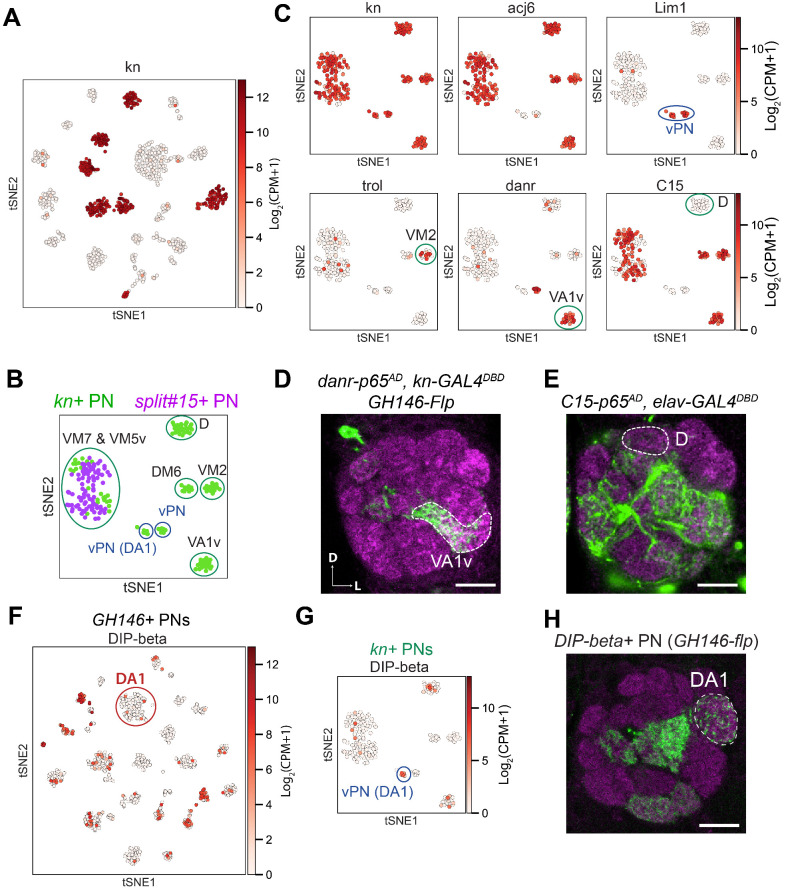
Figure 2—figure supplement 3. Decoding the identity of kn+ projection neurons (PNs).

Figure 2—figure supplement 3.

(A) kn is expressed in seven transcriptomic cluster in GH146+ PNs at 24 hr APF. (B) Visualization of kn+ and split#15-GAL4+ PNs at 24 hr APF using tSNE. kn+ PNs (green) form eight clusters, two of them intermingled with split#15-GAL4+ PNs (purple). These eight clusters are assigned to specific PN types using information in the following panels. (C) Summary of marker genes used to decode the identity of kn-GAL4+ PNs. trol+ cluster represents VM2 PNs (Li et al., 2017). (D) Intersection between kn-GAL4DBD and danr-p65AD with GH146-Flp revealed that the cluster positive for both kn and danr is VA1v PNs. (E) Intersection between C15-p65AD and elav-GAL4DBD revealed that the cluster positive for acj6 but negative for C15 is D PNs. (F) Visualization of DIP-beta expression among GH146+ PNs. DA1 lPNs does not express DIP-beta. (G) Visualization of DIP-beta expression among kn+ PNs. One vPN cluster expresses DIP-beta. (H) Representative confocal image of DIP-beta-GAL4 after intersecting with GH146-Flp. Innervation of the DA1 glomerulus indicated the DIP-beta+ vPN cluster is vPN (DA1). Scale bars, 20 μm. Axes, D (dorsal), L (lateral).