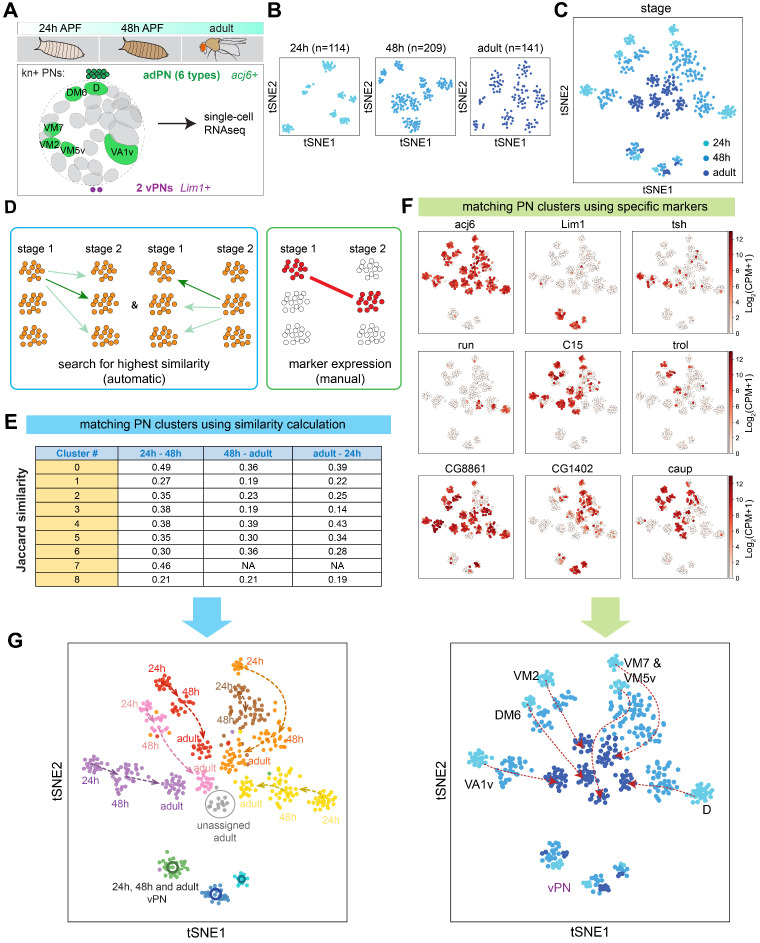
Figure 6. Two complementary approaches to match transcriptomic clusters representing same projection neuron (PN) types at different developmental stages.
(A) scRNA-seq was performed for kn+ PNs from three different developmental stages: 24 hr APF, 48 hr APF, and adult. (B) tSNE plots showing kn+ PNs from three different stages, plotted separately. Cells are clustered according to 24 hr ICIM genes. Cell numbers are indicated. (C) kn+ PNs from three different stages plotted in the same tSNE plot. Cells are clustered according to 24 hr ICIM genes. (D) Two approaches were used for matching the same PN types at different stages: (1) automatic prediction by calculating the transcriptomic similarity between clusters at two stages (2) manual matching of clusters using specific markers or marker combinations. (E) Jaccard similarity index of automatically matched transcriptomic clusters from different stages. Clusters #7 (brown cells in panel G) in 24 hr and 48 hr APF do not match with any cluster in the adult stage; therefore, the similarity calculation is left as not applicable (NA). (F) Examples of markers used to manually match transcriptomic clusters representing the same PN types across different stages. (G) All kn+ PN types (six adPNs and three vPNs) are matched from three different stages. Two independent approaches (automatic and manual) produced similar results.


