
Figure 2.
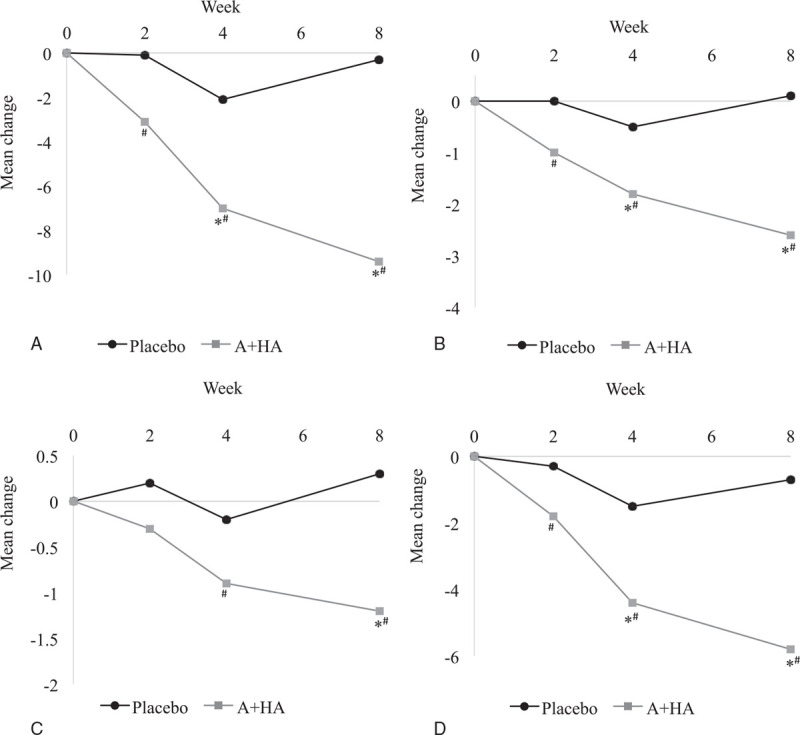
Mean change from baseline in WOMAC. The mean change of (A) total score and the scores of (B) pain, (C) stiffness, and (D) physical function subscales are shown. ∗P value < .05 against placebo group and #P value < .01 against baseline. WOMAC = Western Ontario and McMaster Universities Osteoarthritis Index.