

Summary
Spaceflight is known to impose changes on human physiology with unknown molecular etiologies. To reveal these causes, we used a multi-omics, systems biology analytical approach using biomedical profiles from fifty-nine astronauts and data from NASA’s GeneLab derived from hundreds of samples flown in space, to determine transcriptomic, proteomic, metabolomic, and epigenetic responses to spaceflight. Overall pathway analyses on the multi-omic datasets showed significant enrichment for mitochondrial processes, as well as innate immunity, chronic inflammation, cell cycle, circadian rhythm, and olfactory functions. Importantly, NASA’s Twin Study provided a platform to confirm several of our principal findings. Evidence of altered mitochondrial function and DNA damage was also found in the urine and blood metabolic data compiled from the astronaut cohort and NASA Twin Study data, indicating mitochondrial stress as a consistent phenotype of spaceflight.
Keywords: Mitochondria, lipids, spaceflight, GeneLab, NASA Twin Study, NASA, Rodent Research Missions, cell cycle, oxidative phosphorylation, immune system, circadian rhythm, olfactory pathways, microgravity, space radiation, metabolism, metabolic modeling, proteomics, transcriptomics, metabolomics
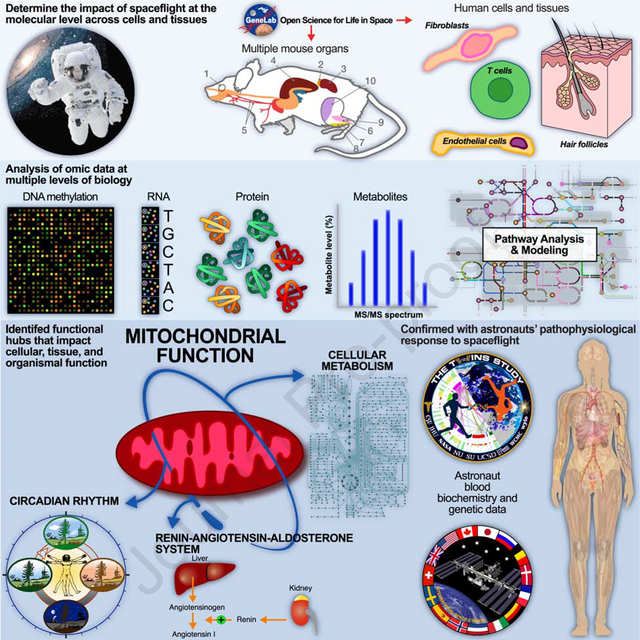
Graphical Abstract
In Brief:
A comprehensive multi-omics analysis from 59 astronauts, and hundreds of samples flown in space, provides insight into fundamental biological mechanisms affected by spaceflight and highlights mitochondrial dysregulation as a central hub for space biology.
Introduction
Humanity is on the brink of a new era in space exploration, with NASA and international partners committed to returning to the Moon and planned manned missions to Mars (Dawson, 2016). Exposure to space radiation and microgravity are primary hazards to astronauts’ health in long-duration space missions (Garrett-Bakelman et al., 2019). In addition to the known increased cancer risk from chronic low doses of radiation exposure (Durante and Cucinotta, 2008), astronauts that returned from missions on the International Space Station (ISS) presented with health issues similar to geriatric stress, including bone and muscle mass loss, central nervous system issues, immune dysfunction, and cardiovascular health risks (Strollo et al., 2018). Future success in long-duration space exploration requires a comprehensive understanding of the impact of spaceflight on human biology, and such knowledge could be used to design efficient countermeasures that would benefit astronauts and the health of people on Earth.
Here, we provide an integrated analysis of mammalian space biology using a systems biology approach powered by multiple “omic” platforms. Realized by the existence of NASA’s GeneLab (https://genelab.nasa.gov/) (Ray et al., 2019), a dedicated space omics database, our work includes 4 human cell models, 13 different tissues (11 mouse and 2 human), 2 mouse strains (C57BL/6 and BALB/C), and space missions ranging from 2006 to 2017, culminating in the measurement of astronaut blood and urine metabolites, as well as transcriptional data from the NASA Twin Study (Garrett-Bakelman et al., 2019; Gertz et al., 2020).
Our data-driven approach resulted in three discoveries. First, spaceflight effects were more evident in isolated cells than whole organs, suggesting that tissue complexity plays an essential role in response to space-related stress. Second, the liver undergoes more differential gene and protein expression changes than other organs, consistent with the role the liver plays as a dynamic and critical hub in sensing changes in blood composition and maintaining homeostasis. Finally, our comprehensive pathway analyses identified how spaceflight impacts mitochondrial function at the genetic, protein, and metabolite levels of cellular, tissue, and organismal biology.
Results
Cellular and tissue dynamics altered by spaceflight
Global analysis of the mRNA, protein, and metabolite responses to spaceflight across all GeneLab data (Fig. 1A–1D and Table S1) was performed by calculating the average number of differentially detected molecules between in-flight (FLT) and ground control (GC) samples. We found that cultured human cells and primary human hair follicles had the strongest response to spaceflight than other cells and tissues (vs genes regulated with adj. p<0.05). From the ten mouse tissues included in the analysis, we found that the soleus muscle, extensor digitorum longus (EDL) muscle, and liver had the highest number of differentially expressed genes (Table S1).
Figure 1. Global analysis of the transcriptomics, proteomics, and metabolomics datasets.
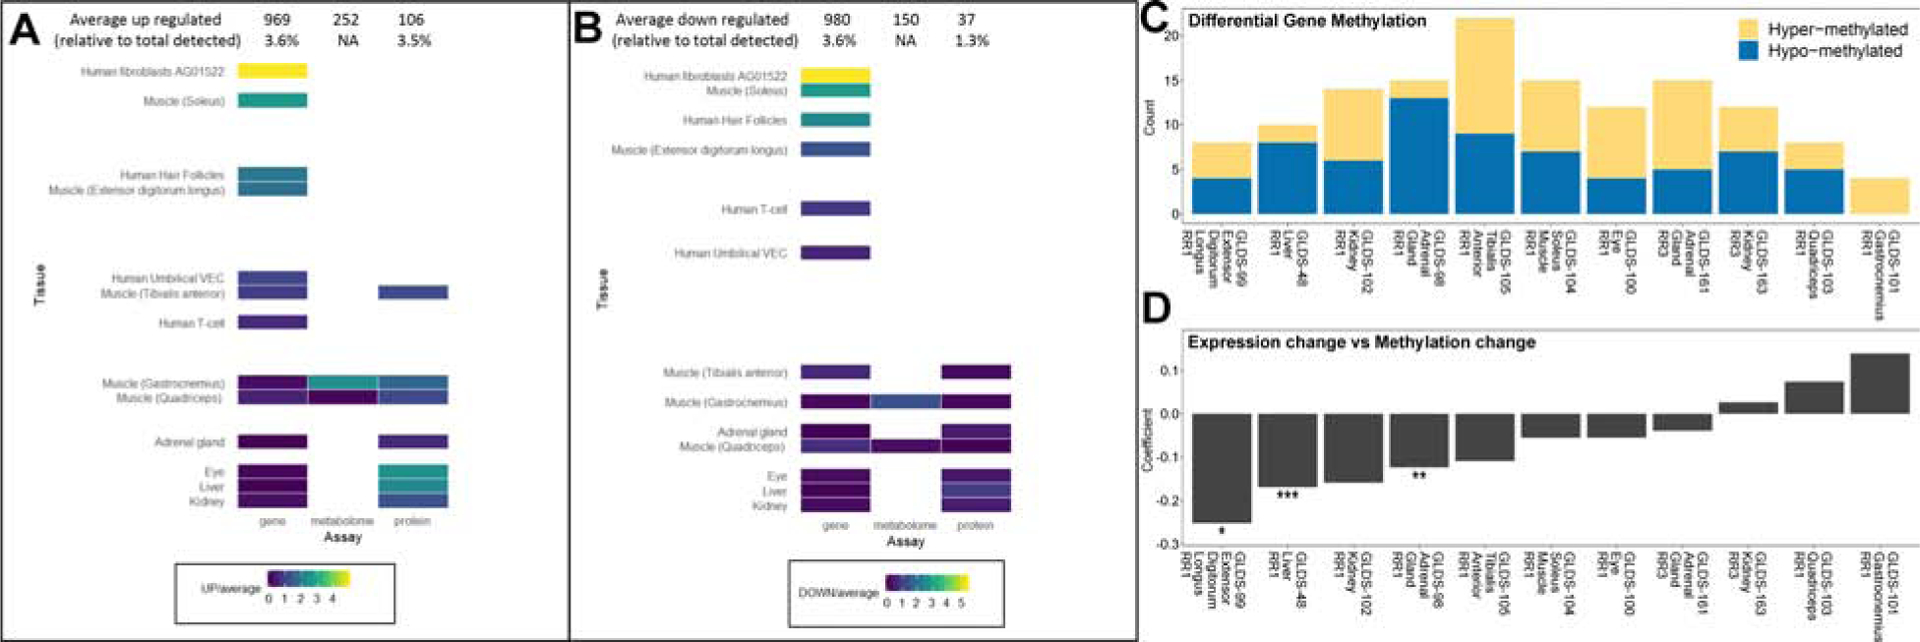
To provide a global view of the changes occurring for all GeneLab data used in this manuscript we computed the overall mean levels of up (A) and down (B) regulated molecules across all data sets for each assay and normalized to the individual levels of up and down regulated gene/protein/metabolite by dividing by the average of each assay. Note that regulation here refers to flight versus ground samples. C) Overall summary of the Differential Gene Methylation for hyper- and hypo-methylated genes. D) The relationship between absolute methylation and expression for all genes in each dataset and correlating it to the median promoter methylation of that gene. Significance of the relationship between the methylation change and expression change was calculated by taking the log2 fold-change values for gene expression and methylation and fitting a linear model. The significance is displayed on the plot by * p-value < 0.05, ** p-value < 0.01, and *** p-value < 0.001.
As gene expression can be regulated or maintained epigenetically by DNA methylation, we found that EDL muscle and liver had an association between hypomethylation and increased gene transcription (Fig. 1A–1D). Our results in muscle tissue are consistent with previous findings (Beheshti et al., 2018), suggesting reduced muscle loading due to microgravity is a strong driver of gene regulation that can influence transcriptional responses to spaceflight. Consistent with that concept, we analyzed global differences between two common inbred strains of mice with distinct genetic backgrounds and found that C57BL/6 was more responsive at a transcriptional level to spaceflight than BALB/c (Table S1).
The systemic mitochondrial stress response pathway is induced by spaceflight at the cellular and tissue level.
To uncover the underlying systemic impact of spaceflight on astronauts, we analyzed four human cell line in vitro datasets available on GeneLab. Since these datasets are from legacy microarray data, comparisons were performed by Gene Set Enrichment Analysis (GSEA) for the overlapping pathways, using a false discovery rate cutoff of less than 10% (Fig. 2A). We found one overlapping collection of gene sets across all four cell types (fibroblasts, endothelial cells, primary T cells, and hair follicles). Remarkably, this overlap contained multiple mitochondrial function GO terms: mitochondrial ATP synthesis, mitochondrial electron transport, oxidative phosphorylation, and hydrogen ion transmembrane transportation (overlapping pathways in Fig. 2A). These data support the concept that spaceflight causes a universal change in gene expression related to energy generation.
Figure 2: Mitochondrial related pathways and mitochondrial genes affected by spaceflight in cells and mice.
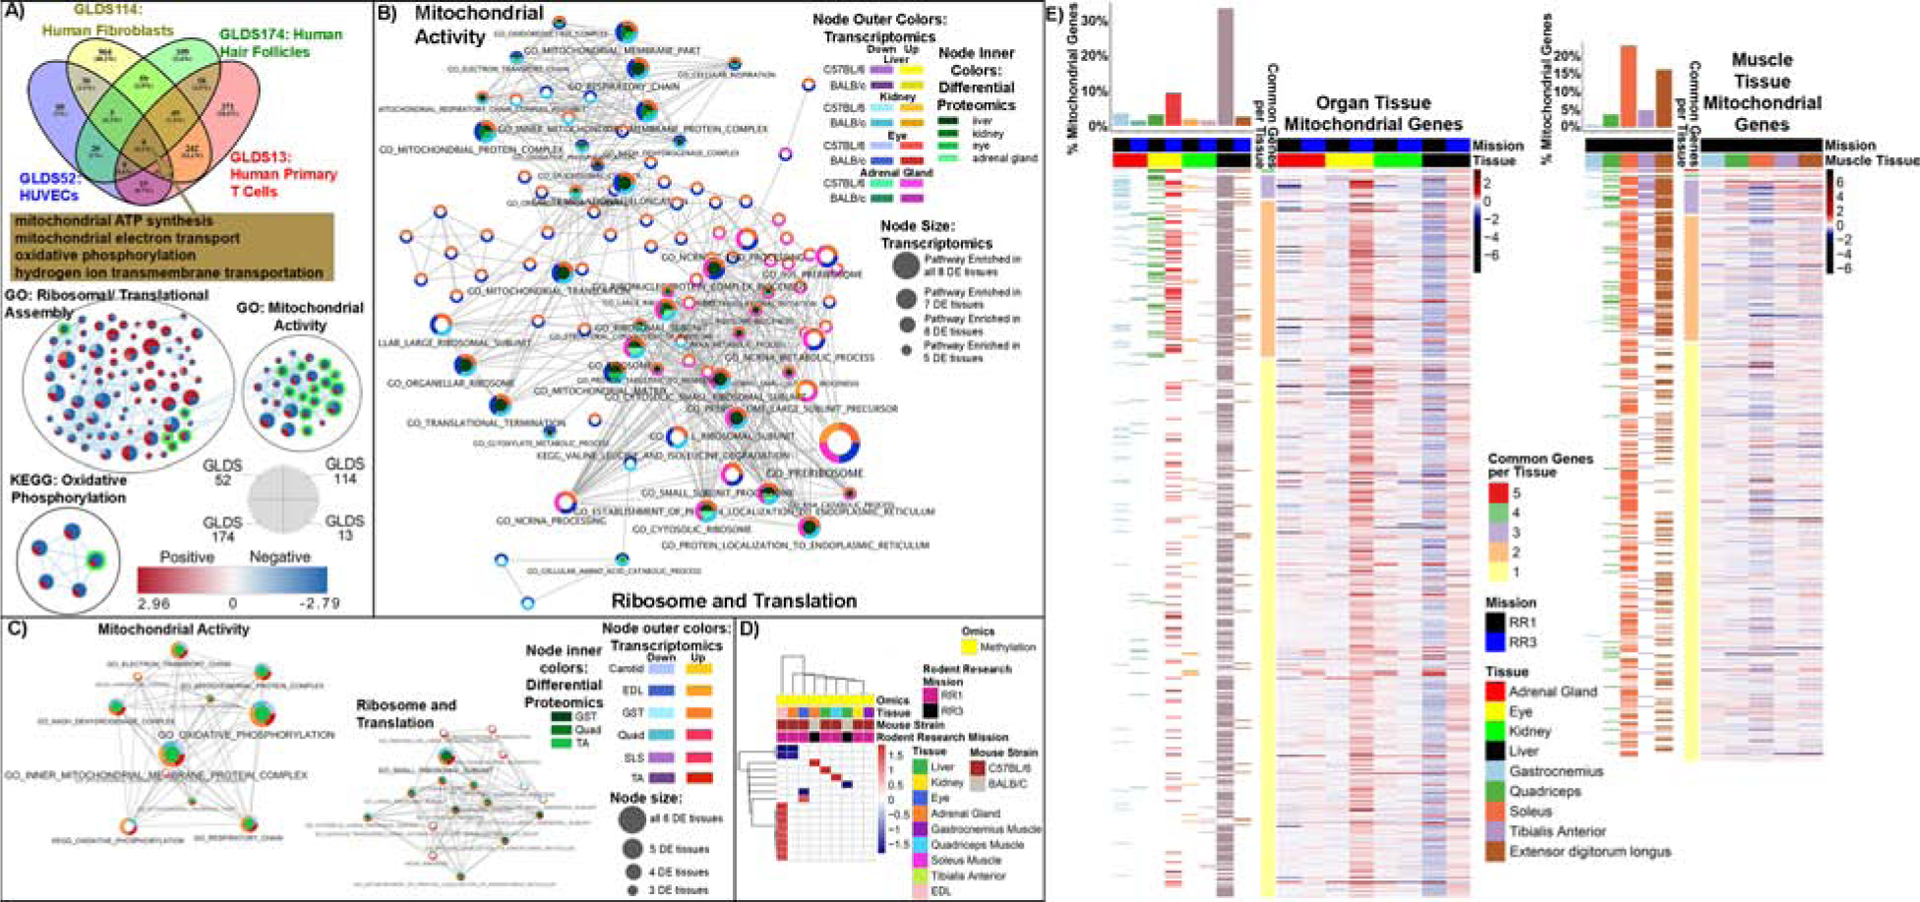
A) Pathway analysis of the impact of spaceflight on in vitro data. Gene Set Enrichment Analysis (GSEA) comparing flight to ground treatments. Venn diagrams of statistically significant Gene Ontology (GO) gene sets with FDR < 10%. Cytoscape enrichment maps of GO and KEGG sets with FDR <10% in at least two GLDS datasets. Each node contains 4 wedges for each dataset (indicated by the legend in the figure) and the color of each wedge indicates if the gene set is downregulated (blue) or upregulated (red). The shade of the color indicates degree of regulation. The thickness of the edge (blue lines) represents the number of genes associated with the overlap of the gene sets (or nodes) that the edge connects. In addition, the green highlighted nodes represent the gene sets related to mitochondrial pathways. B) Liver, Kidney, Eye and Adrenal Gland Tissue Analysis from C57BL/6 and BALB/C mice from mission RR1 and RR3, C) C57BL/6 extensor digitorum longus (EDL), gastrocnemius (GST), quadriceps (Quad), soleus (SLS), tibialis anterior (TA), and BALB/C carotid artery (Carotid). B) and C) Pathway results were integrated across multiple tissues and RNAseq and proteomics platforms to summarize the system-wide effects of spaceflight compared to ground control. Enriched GO terms and KEGG pathways were integrated using a network framework, where two pathways are connected by an edge if they share a significant fraction of genes. Pathways dysregulated in two or more tissues are displayed. Pathway up and down regulation is encoded by node color, and pathways dysregulated by multiple tissues are mapped to larger node size. D) Heatmap representation of GSEA analysis on the methylated genes from both mission. E) Heatmap representation of all mitochondrial genes that are significantly expressed (FDR < 0.05) between spaceflight vs ground fold-change values for all tissues. The mitochondrial genes were obtained from MitoCarta. The panel on the left of the heatmap shows the distribution of the significantly regulated (FDR < 0.05) mitochondrial genes for each comparison.
Next, we extended our network analyses to data from mouse tissues to identify changes that span DNA to RNA to protein in response to spaceflight. This collection included transcriptomics, proteomics, and epigenetics data of liver, kidney, eye, and adrenal gland tissues from two different mouse strains (C57BL/6 and BALB/c) housed on the ISS for 33 and 37 days, respectively. We linked mitochondrial stress in the tissues and cells to ribosomal and translational changes (Fig. 2A–2C, S1, and Tables S2 and S6). Specifically, we found ribosome assembly, mitochondrial, and cytosolic translation pathways altered, implying proteostasis failure induced by spaceflight (Lu and Guo, 2020). We observed a consistent change in mitochondrial pathways across most tissues we tested, except in the adrenal gland and soleus muscle (Figs. 2B and 2C). The direction of transcriptional changes repeats at the epigenetic level in the internal organs and muscles (Fig. 2D). Lastly, to determine specific mitochondrial activity per tissue from mice flown in space, we analyzed a panel of mitochondrial genes identified from the MitoCarta resource (Calvo et al., 2015) (Fig. 2E). Liver contained the most mitochondrial activity across all organs, while the soleus and EDL had the most mitochondrial activity amongst the muscles (Fig. 2E).
We analyzed metabolomic data from gastrocnemius and quadriceps muscle from both FLT and ground control GC C57BL/6 mice (RR9) to confirm potential metabolic changes in these tissues. Pathway enrichment analyses of metabolites from this data showed significant alterations in response to spaceflight (Fig. 3A, S2A, and Table S4), and the enrichment of several mitochondrial and energy-related pathways, such as β-oxidation of long-chain fatty acids and tricarboxylic acid cycle (Fig. 3A). L-carnitine and malate (Fig. S2B), two examples of metabolites involved in ATP generating processes, showed distinguishable increases in the muscles. Our analyses suggest that tissues vary in their stress response to spaceflight as it pertains to mitochondrial function. Alternatively, our observation could reflect different adaptive energy requirements of each tissue.
Figure 3. Mitochondrial related metabolites, mitochondrial gene confirmation from NASA Twin Study data, and astronaut blood and urine parameters affected by spaceflight.
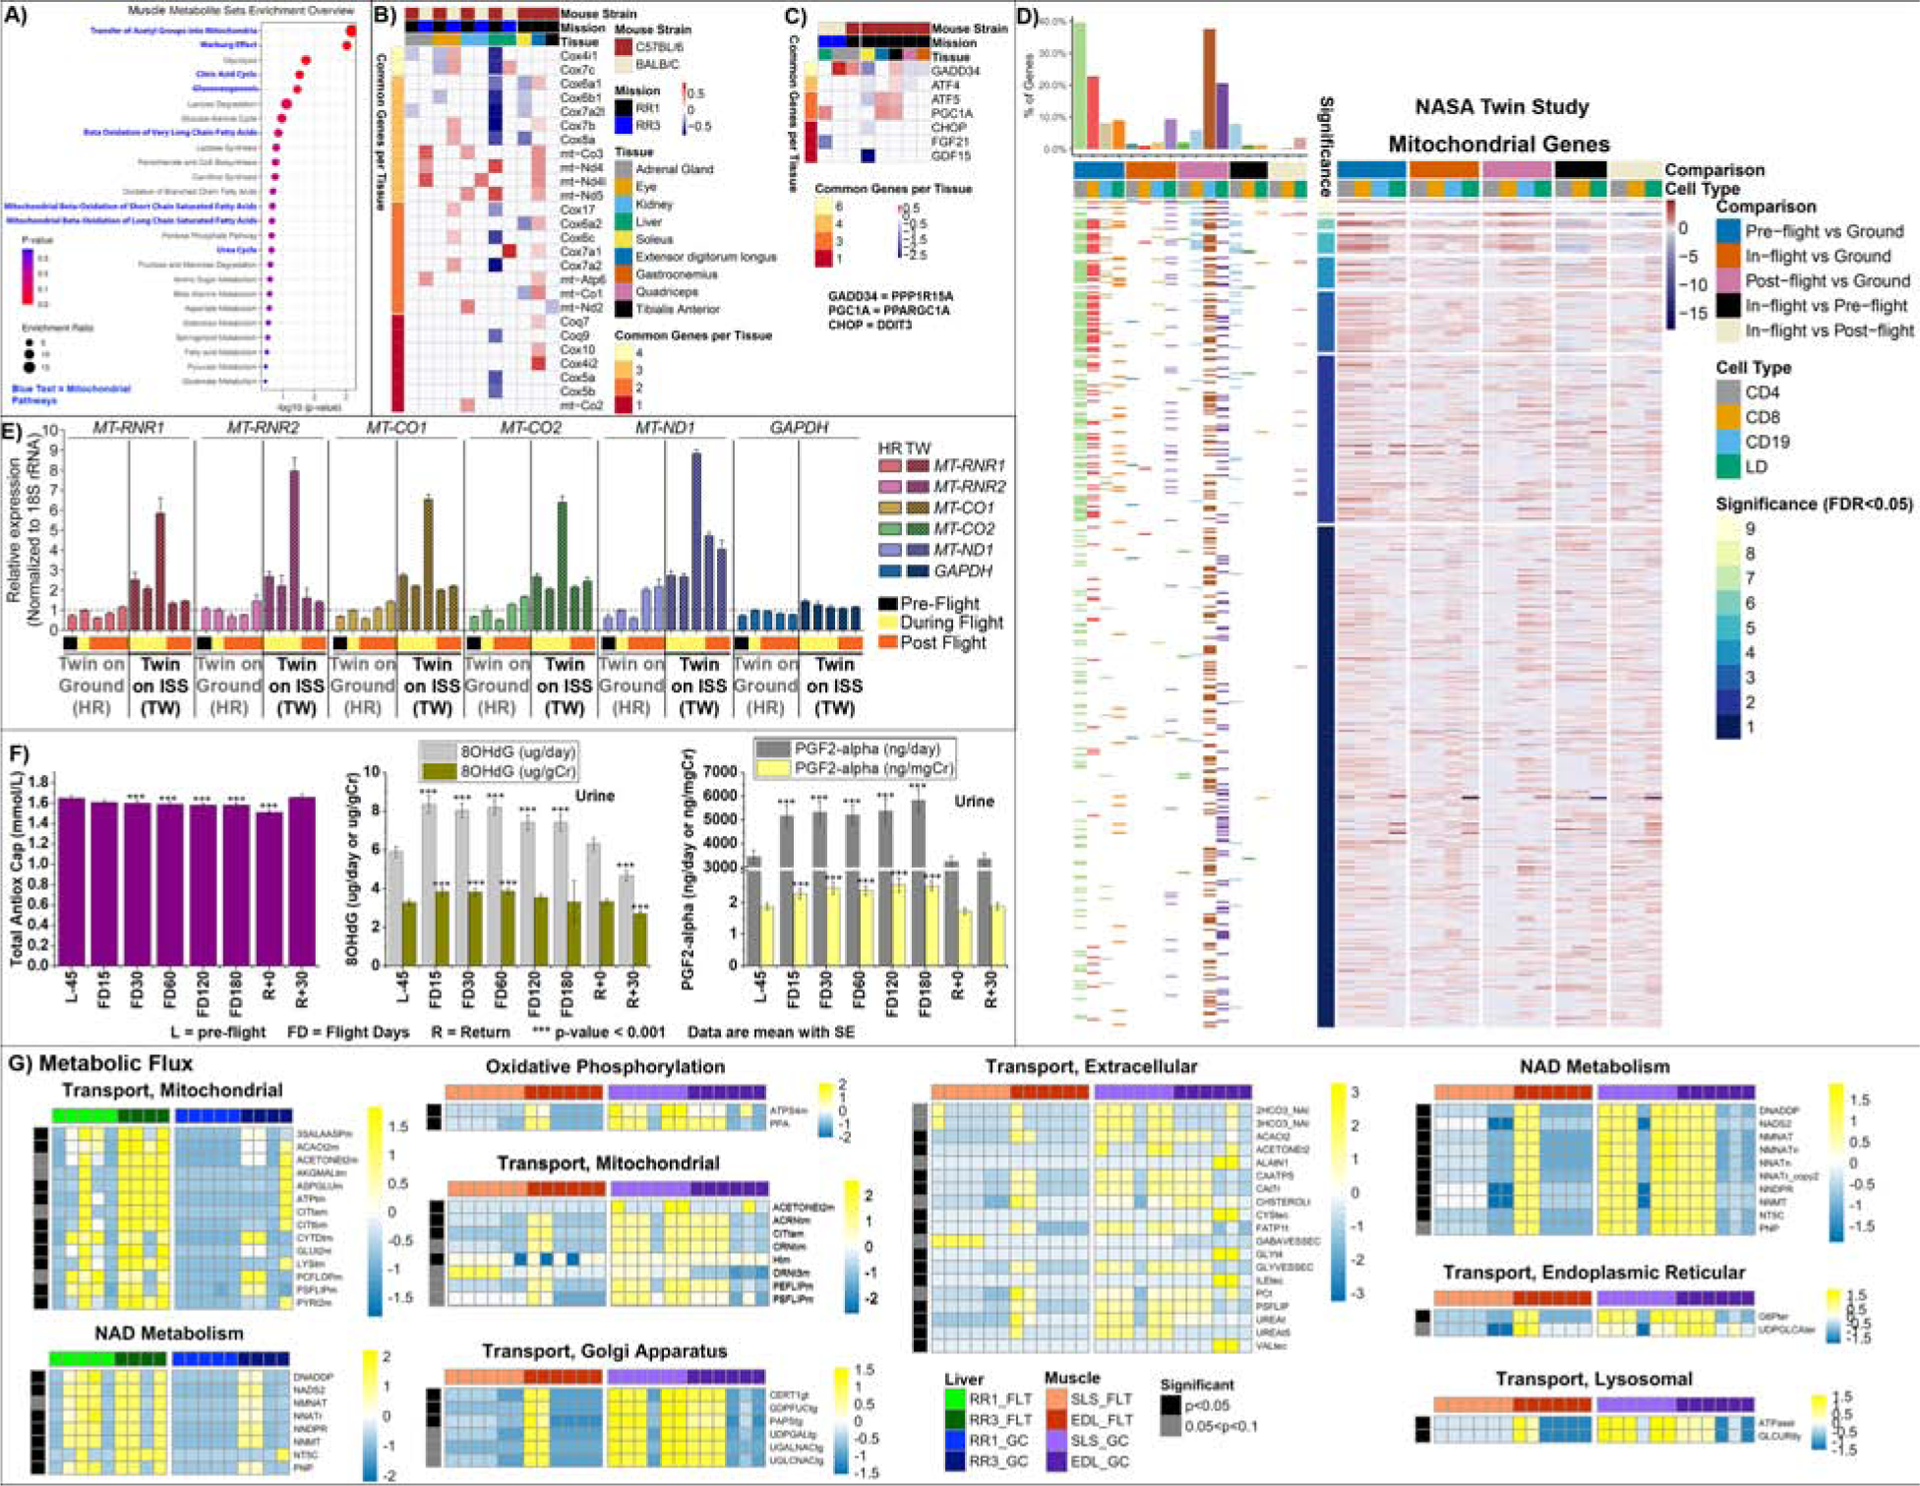
A) C57BL/6 (RR9 mission) gastrocnemius and quadriceps Pathway enrichment analysis based on the subset of validated metabolites from Table S4. Blue letters highlight pathways with mitochondrial involvement. B) Heatmap representation of differential expression (log2(fold-change) of spaceflight vs ground comparison) of down-regulated nDNA and up-regulated mtDNA coded mitochondrial genes in oxidative tissues from C57BL/6 and BALB/C mice. C) Heatmap representation of differential expression (log2(fold-change) of spaceflight vs ground comparison) of Integrated Stress Response (ISR) genes and PGC1α. The figure legend for (B) and (C) are shared. D) Heatmap representation of the all the mitochondrial genes that are significantly expressed (FDR < 0.05) from RNA-sequencing on the T Lymphocyte CD4+ and CD8+, B Lymphocyte CD19+, and lymphocyte depleted (LD) cells in the blood from the NASA Twin study. Log2(fold-change) values are shown in the heatmap between the Twin in space for pre-, in-, and post-flight compared to the Twin on the ground. The panel on the left of the heatmap shows the distribution of mitochondrial genes for each comparison. The colors in the heatmap represent red being upregulated and blue being downregulated. The mitochondrial genes were obtained from MitoCarta. E) qRT-PCR on NASA Twin study samples comparing ground and flight samples from whole-blood cell fractions for expression of the indicated mitochondrial genes has been plotted relative to 18S rRNA. Solid bars represent the ground samples (HR) over time and the patterned bars represent the flight samples (TW) over time. Expression in the 100215_CPT_HR ground sample (the second bar for ground samples) was set as 1. Sample details can be found in Table S5. The x-axis displays color-coded bars indicating which samples are pre-flight (black), during flight (yellow), and post-flight (orange). The error bars represent technical replicates. F) Levels of antioxidative capacity, 8OHdG, and PGF2-alpha in astronauts’ blood and urine for 59 crewmembers. Repeated measures analysis of variance was conducted to test for differences during and after flight compared to preflight, and comparisons among time points were made using a Bonferroni t-test. Multiple comparisons were accounted for, and only those tests with p<0.001 are reported. Full data table available in Table S3. G) Heatmaps show flux values (rows) vs mice (columns) from both RR1 and RR3 experiments for liver and muscle. Flux values are calculated as described in the methods, showing in the leftmost bar those fluxes whose differential testing results between FLT and GC result in p-values<0.05 (black) or suggestive where p-values fall between 0.05 and 0.1 (grey). Heatmap color scales indicate row-wise Z-scores for a particular flux, with Z-score ranges for that map indicated by key. Links to full heatmaps with all fluxes for all pathways in the tested tissues, as well as flux maps for the above can be found at https://osf.io/utmwf/ which also includes data used to generate these figures.
Mitochondrial dysfunction as a consequence of spaceflight
We observed mitochondrial dysfunction as a significant consequence of long-term space fight in both mouse models and humans by comparing spaceflight versus ground-based twins (Fig. 3). Observed changes include altered mitochondria-associated metabolites and modified nDNA and mtDNA OXPHOS gene expression (Fig. 3B), reduced antioxidant defenses and increased urinary markers of oxidative stress (Fig. 3F), and altered integrated stress response (ISR) gene expression (Fig. 3C). These and related observations suggest that mitochondrial dysfunction may alter metabolic flux through mitochondrial pathways, perturb mitochondrial gene expression, and activate the ISR.
We also observed opposite trends in transcriptional expression of nDNA versus mtDNA derived mitochondrial genes in livers from mice from the RR3 experiment (BALB/c) (Fig. 3B), further supporting the concept of spaceflight-associated mitochondrial dysfunction. In the liver, the nDNA-coded oxidative phosphorylation (OXPHOS) transcripts were strongly down-regulated, including cytochrome c oxidase (Cox4i1, Cox5a, Cox4i1, Cox5a, Cox5b, Cox6a1, Cox6b1, Cox6c, Cox7a2, Cox7a2l, Cox7b, Cox7c, Cox8a) as well as for coenzyme Q biosynthesis (Coq9). In contrast, we found a strong upregulation of the liver mtDNA-coded OXPHOS genes mt-ND4 and mt-ND5. The kidney also showed the induction of the mtDNA-coded subunits (mt-Nd2, mt-Nd4l, mt-ND5, mt-Co2, mt-Co3), and in the oxidative soleus muscle, the nDNA-coded COX genes were also down-regulated. In the EDL, a highly glycolytic tissue, we observed higher levels of mtDNA OXPHOS genes (mt-Co1, mt-Co3, mt-Nd4, mt-Nd4l, mt-Nd5, mt-Atp6), although nDNA-coded mitochondrial genes were not decreased (Fig. 3B). These observations support the conclusion that spaceflight suppresses nDNA-coded mitochondrial OXPHOS gene expression predominantly in oxidative tissues, and the induction of the mtDNA genes partially compensates for the diminished mitochondrial oxidative metabolism.
The reason for the opposite changes in transcription of the nDNA- and mtDNA-coded mitochondrial OXPHOS genes in spaceflight is unclear, but our results suggest that oxidative damage contributes to decreased nDNA OXPHOS transcripts. Levels of the transcriptional coactivator, PCG1α, which controls both sources of OXPHOS genes (Spiegelman and Heinrich, 2004) are increased in the liver, anterior tibialis, and EDL (Fig. 3C), which would be consistent with increased mitochondrial biogenesis.
If these opposite trends in the differential transcription of the nDNA- and mtDNA-coded mitochondrial OXPHOS genes extend to the protein level, this would lead to imbalances in the assembly of OXPHOS complexes and promote the mitochondrial unfolded protein response (UPRMT) (Houtkooper et al., 2011). Activation of the UPRMT can activate the integrated stress response (ISR) (Fig. 3C). For example, oxidative stress activates four kinases (GCN2, PKR, HRI, PERK) that initiate the ISR by regulating the phosphorylation of the cytosolic translation elongation factor 2 alpha (eIF2α) (Pakos-Zebrucka et al., 2016). Phosphorylation of eIF2α reduces the cytosolic initiation complex (eIF2-GTP-Met-initiation tRNA), resulting in the preferential translation of mRNAs with an upstream ORF (uORF1) and activates the ISR (Balsa et al., 2019b; Quiros et al., 2017; Wong et al., 2019). ATF5 binds the amino acid receptor elements to upregulate 1-carbon folate metabolism, glutathione metabolism, and the stress response factors FGF21 and GDF15 (Forsstrom et al., 2019; Khan et al., 2017b). GADD34 dephosphorylates p-eIF2α, allowing protein synthesis to return to normal (Fig. 3C).
Our analysis of ISR-related genes expression from two murine space missions, RR1 and RR3 (Fig. 3C), showed that Gadd34 was increased in the adrenal gland in both missions. In the RR3 mission, Gadd34 was down-regulated in the oxidative soleus muscle and upregulated in the glycolytic anterior tibialis muscle, while the stress gene Atf5 was upregulated in both the anterior tibialis and in the EDL muscle, which is also a predominantly glycolytic muscle. Finally, we observed the downregulation of the stress response genes Fgf21 or Gdf15 in liver or soleus muscle, respectively. Therefore Atf5, Chop, and Gdf15 are downregulated in oxidative muscle during spaceflight, consistent with reduced ISR. In contrast, the increase in Atf5 and Gadd34 gene expression in glycolytic muscle suggests increased ISR. The modulation of Atf5, Chop, Gadd34, and Gdf15 (Fig. 3C) may indicate that the ISR may be a critical retort to spaceflight-induced mitochondrial dysfunction. Activation of the ISR via mitochondrial dysfunction could be in response to the increased oxidative stress, which would impinge on all of the ISR kinases. Alternatively, the imbalance between the nDNA and mtDNA coded OXPHOS proteins, and UPRMT could also activate ISR.
We investigated astronaut data to support the evidence of the biological processes observed in spaceflight mice. First, we analyzed the global mitochondrial levels from different cell populations (T lymphocytes CD4+ and CD8+, B lymphocyte CD19+, and Lymphocyte Depleted (LD) cells) in the blood from the NASA Twin Study (Garrett-Bakelman et al., 2019) (Fig. 3D). Although the mitochondrial levels between the twin in space compared to the ground control differed pre-flight, we observed a significant shift in mitochondrial activity from in-flight to post-flight compared to pre-flight. CD19 cells had the greatest increase in mitochondrial activity post-flight for the twin in space, while mitochondrial activity in the CD4 population was significantly reduced in-flight and post-flight (Fig. 3D).
Next, we measured the expression of five mtDNA genes related to OXPHOS, isolated from whole-blood cell fraction samples from the NASA Twin Study (Garrett-Bakelman et al., 2019) including pre-, during, and post-flight samples, paired to ground control samples (Fig. 3E). All five mtDNA genes showed a similar pattern in response to spaceflight, starting with a 2- to 3-fold increase in expression at the beginning of the twin’s time on the ISS, and the peak was at 7- to 9-fold increase towards the end of the twin’s time on the ISS. In contrast, there were no robust changes in any of the genes from matched samples for the twin on Earth or in GAPDH, a key cytosolic enzyme in the glycolytic pathway. Remarkably, the mtDNA gene expression changes that occurred during spaceflight returned to baseline levels post-flight within a few weeks.
The astronaut in the Twin Study passed only 2% of his lifespan in space (Garrett-Bakelman et al., 2019), whereas the mice from the RR1 and RR3 missions passed approximated 25% of their lifespan at the ISS. From the murine perspective, this was a long-term space mission, a particularly important consideration given the recent findings that mice and humans have different biochemical reaction speeds that affect development (Matsuda et al., 2020).
While we observed an increase in mtDNA gene expression in the Twin Study, spaceflight reduced astronauts’ antioxidant capacity (Fig. 3F), coupled with an increase in urinary markers of oxidative stress including 8OHdG and Prostaglandin F2 alpha (PDGF2-alpha) (Table S4 and Fig. 3F). Urinary 8-OHdG is a biomarker of generalized cellular oxidative stress, a marker of oxidized DNA that signals that DNA repair is occurring, and a risk factor for cancer, atherosclerosis, and diabetes (Wu et al., 2004). PDGF2-alpha levels in urine are primarily related to cyclooxygenase-independent synthesis and oxidative stress (Yin et al., 2007). These data suggest that spaceflight increases oxidative stress as indicated by both blood and urinary markers.
To further examine metabolic changes related to oxidative stress, we derived context-specific metabolic models from the RR1 and RR3 transcriptional data from mice flown to the ISS (Fig. 3G), and performed flux balance analysis (FBA) calculations to derive metabolic flux activity in each tissue optimized for NAD oxidation based on our interest in its central role in mitochondrial metabolism (Liu et al., 2018). Results for flux comparisons between flight and control mice show several notable metabolic pathway groups with opposite trends in muscle versus liver in both mitochondrial activity and oxidative stress (Fig. 3G and Table S7). Modeled flux through the citric acid cycle (CAC) gatekeeping enzyme Citrate Synthase (CSm, Fig. 6C–6D) in FLT vs GC significantly decreased in muscle but was up in liver. While metabolic flux activity does not necessarily directly relate to metabolite concentration, our flux model results do not disagree with our MS/MS experimental observations of increases in free muscle L-carnitine and malate. The CAC malate dehydrogenase (MDHm) flux that converts malate to oxaloacetate is significantly reduced in FLT vs GC muscle, as are mitochondrial Carnitine O acetyltransferase (CSNATm), which converts carnitine into acetyl carnitine, and Malonyl-CoA Decarboxylase (MCD), which converts the fatty acid metabolism antagonist malonyl-CoA (Brady et al., 1993) (Fig. 6C–6D). Fluxes related to carbohydrate metabolism also show differential changes and are mapped in Figs. S7 and S8. Files associated with flux results and statistical tests are included as supplemental files.
Figure 6. Lipid metabolism related pathways and blood parameters affected by spaceflight in mice and in astronauts.
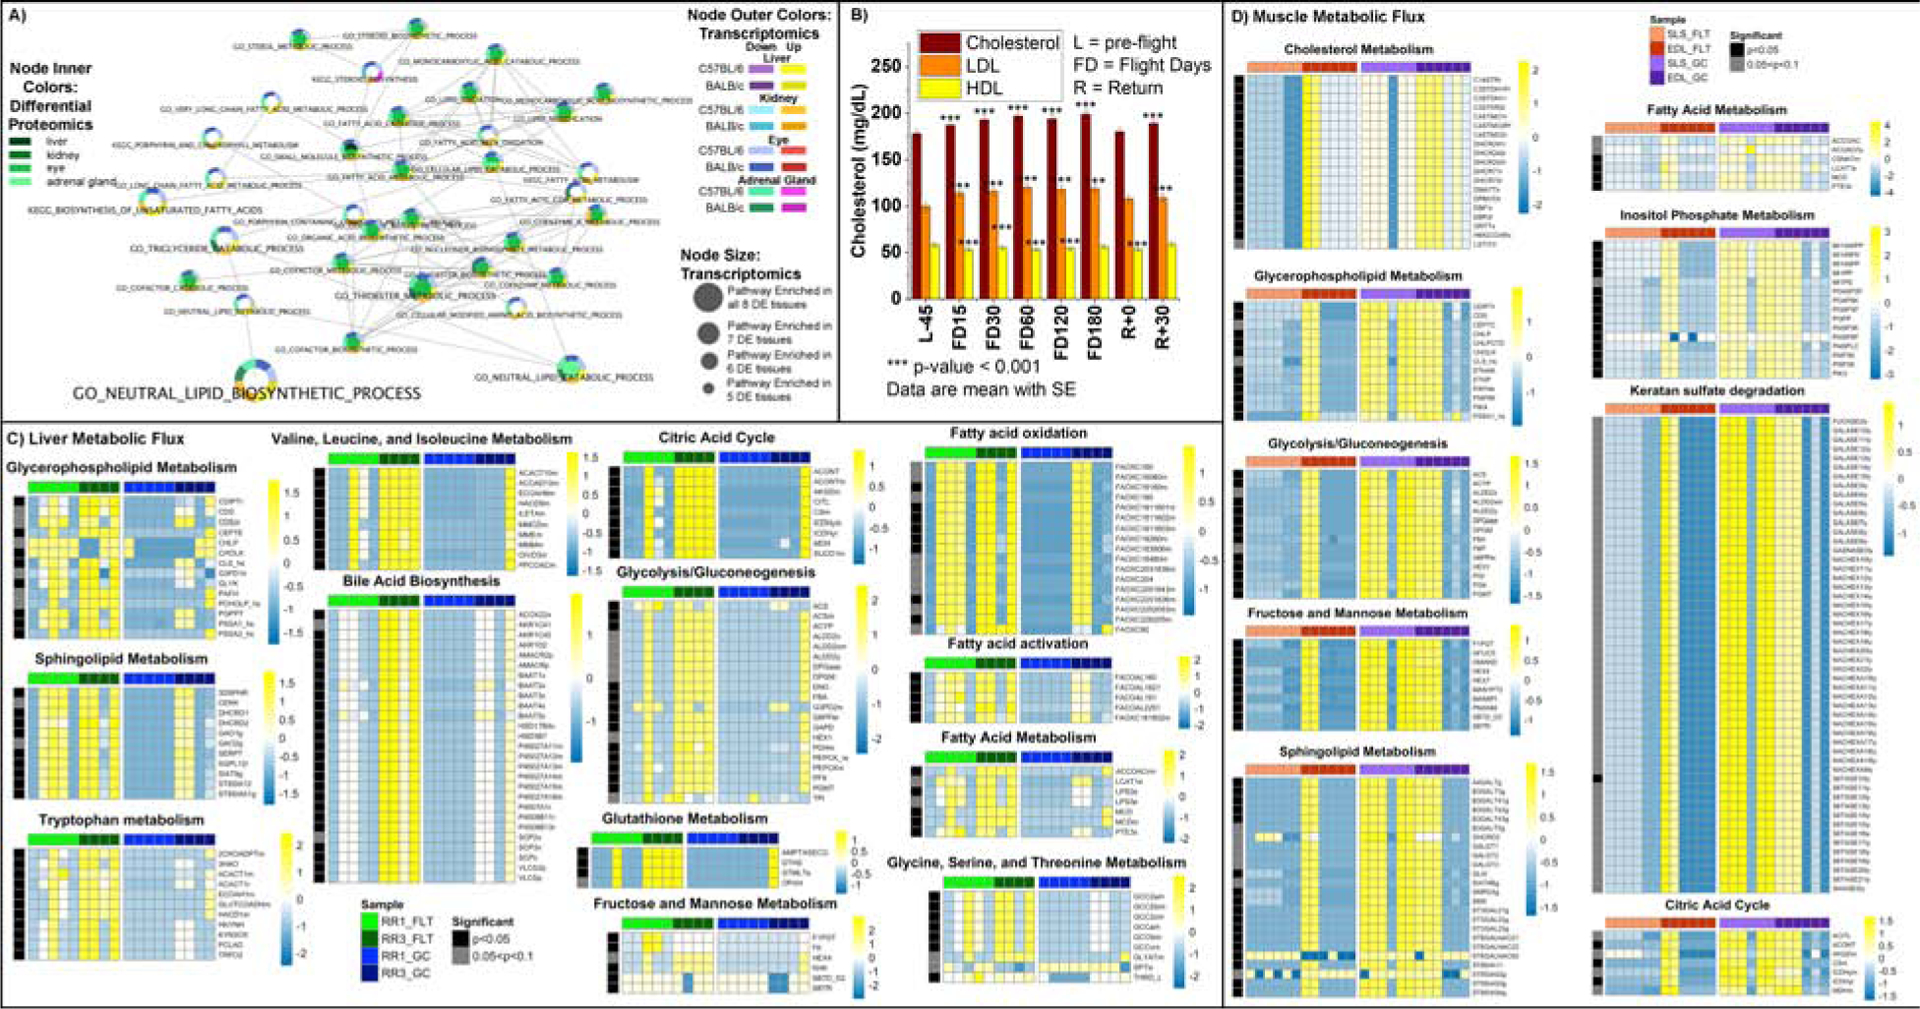
A) Pathway results were integrated across multiple tissues and RNAseq and proteomics platforms and details for analysis is available in Figure 2B and 2C. B) Blood levels for cholesterol and LDL in astronauts for 59 crewmembers. Details available on analysis in Figure Legend 3F. Full data table available in Table S3. C) and D) Heatmaps show flux values (rows) vs mice (columns) from both RR1 and RR3 experiments for liver (C) and muscle (D). Details available on analysis in Figure Legend 3G.
Using these modeled flux values, we can identify the tissue enrichment of mitochondria-localized substrates (MLS) versus the significance of the modeled fluxes. By partitioning fluxes by MLS and p-value significance, a 2×2 chi-square test of independence can detect relationships between mitochondrial substrates and differential flux results within each tissue. Significant fluxes were dominated by MLS, with 91 MLS (out of 316) significant fluxes, vs 81 MLS (out of 591) non-significant fluxes (p = 5.47e-08). In muscle, we found an opposite and significant trend, with a higher ratio of MLS in non-significant fluxes, with 162 MLS (out of 645) non-significant fluxes versus 18 MLS (out of 227) significant fluxes (p = 6.41e-08).
Systemic innate immunity pathway alteration at cellular, internal tissues, and muscle levels induced by spaceflight
Our GSEA analysis identified additional pathways that are affected by the space environment, including immune-related pathways. Cell culture models found an overall upregulation in immune-related pathways during spaceflight (Fig. 4A). In the internal organs, there was also a high presence of activated innate immune system pathways. Immune response through interferon-gamma (IFN-γ) and interferon-alpha (IFN-α) gene sets were down-regulated in the kidney and liver (Fig. 4B), with the epigenetic analysis showing differential methylation of these same gene sets (Fig. 5A). In all muscle tissues, we found an up-regulation in IFN-γ, IL-1, and tumor necrosis factor (TNF) gene sets (Fig. 4C), pathways linked to inflammation-induced muscle wasting (Londhe and Guttridge, 2015). Linked to these immune alterations, gene sets related to the proteasome were altered in both the internal organs and muscles (Fig. 4B and 4C), suggesting protein homeostasis is changed but not limited to the muscle degradation. At the epigenetic level, only EDL and GST muscles showed altered methylation, with EDL showing alteration in the IFN-α (Fig. 5A). However, we observed T-cell activation in the Twins study. These omic datasets suggest that spaceflight alters inflammatory pathways, so we measured circulating inflammatory markers in astronauts. We found decreased 1,25 Vitamin D levels and increased levels of VEGF-1, IGF-1, IL-1α, IL-1β and IL-1ra during spaceflight in astronauts (Fig. 5B), that again resolved to baseline levels upon returning to Earth.
Figure 4: Immune response related pathways and blood parameters affected by spaceflight in vitro and in vivo.
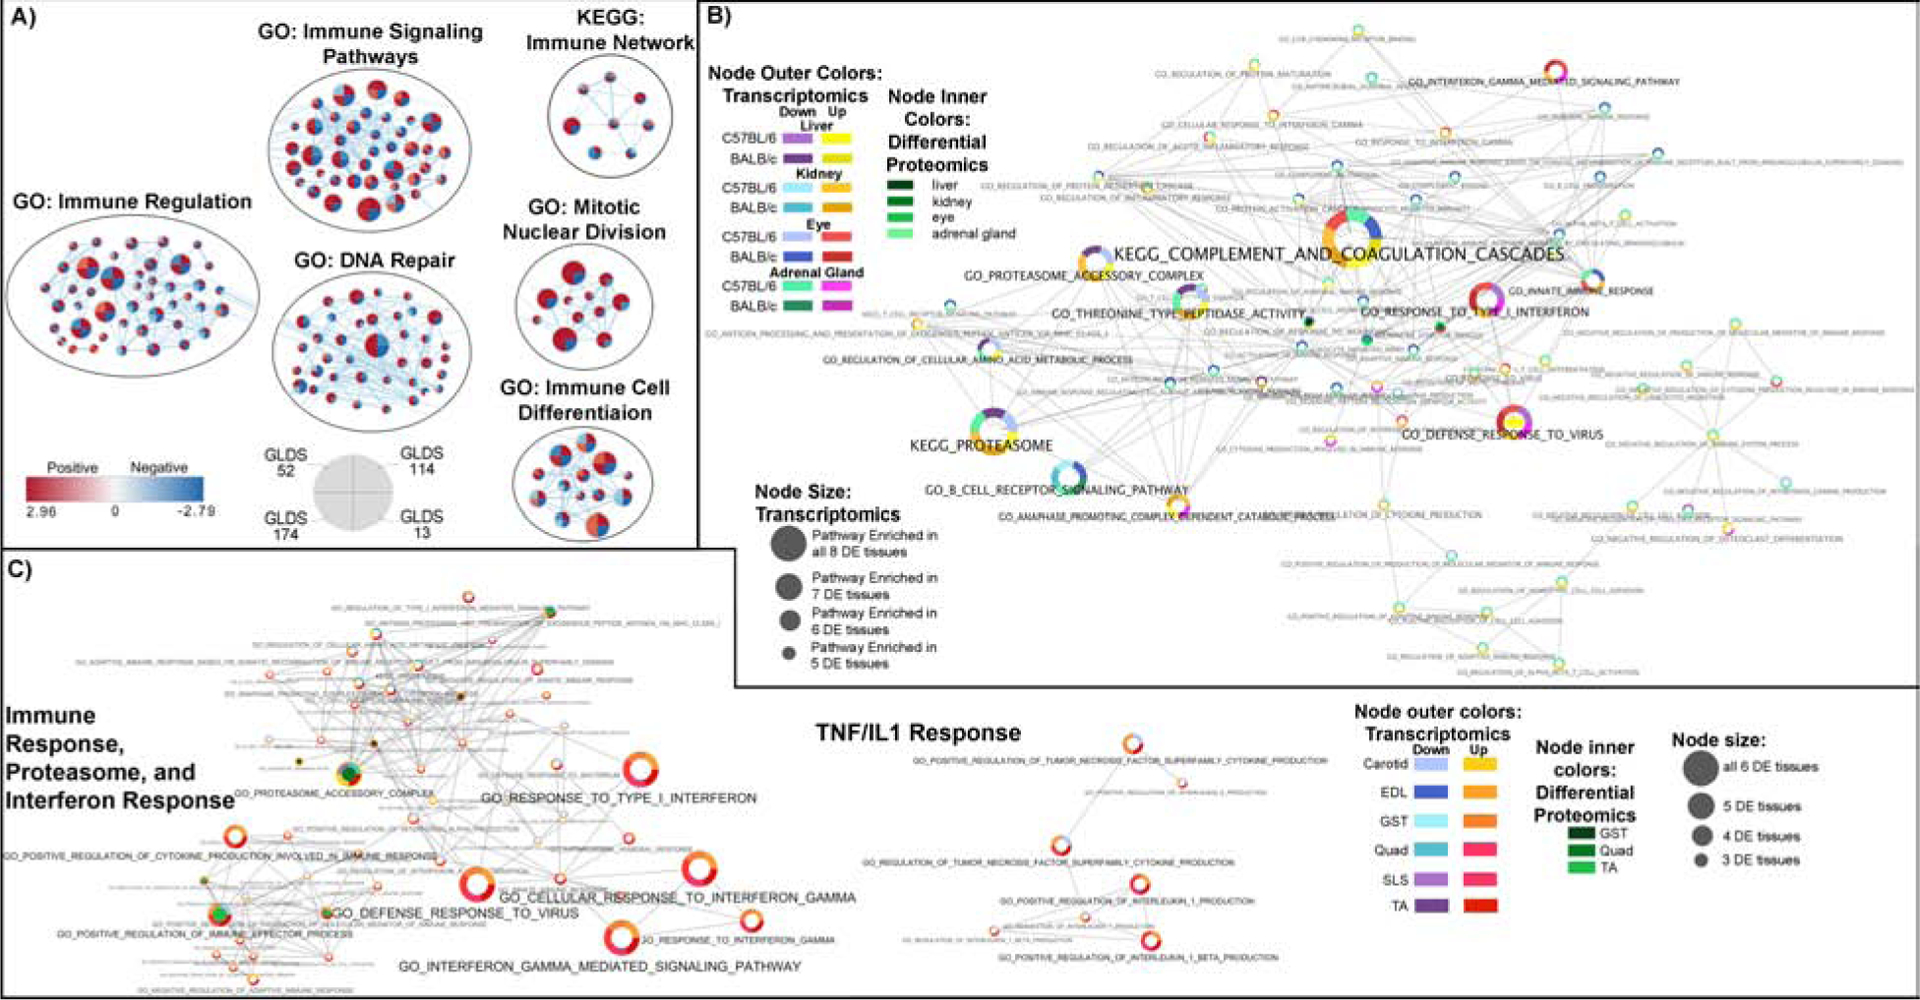
A) Pathway analysis of the impact of spaceflight on in vitro data. Cytoscape enrichment maps from GSEA on GO and KEGG sets with FDR <10% in at least two in vitro GLDS datasets. B) Liver, Kidney, Eye and Adrenal Gland Tissue Analysis from C57BL/6 and BALB/C mice from mission RR1 and RR3, C) C57BL/6 extensor digitorum longus (EDL), gastrocnemius (GST), quadriceps (Quad), soleus (SLS), tibialis anterior (TA), and BALB/C carotid artery (Carotid). B) and C) Pathway results were integrated across multiple tissues and RNAseq and proteomics platforms and details for analysis is available in Figure 2B and 2C.
Figure 5: Immune response related methylated pathways, blood parameters, and bone loss pathways affected by spaceflight in vivo and in astronauts.
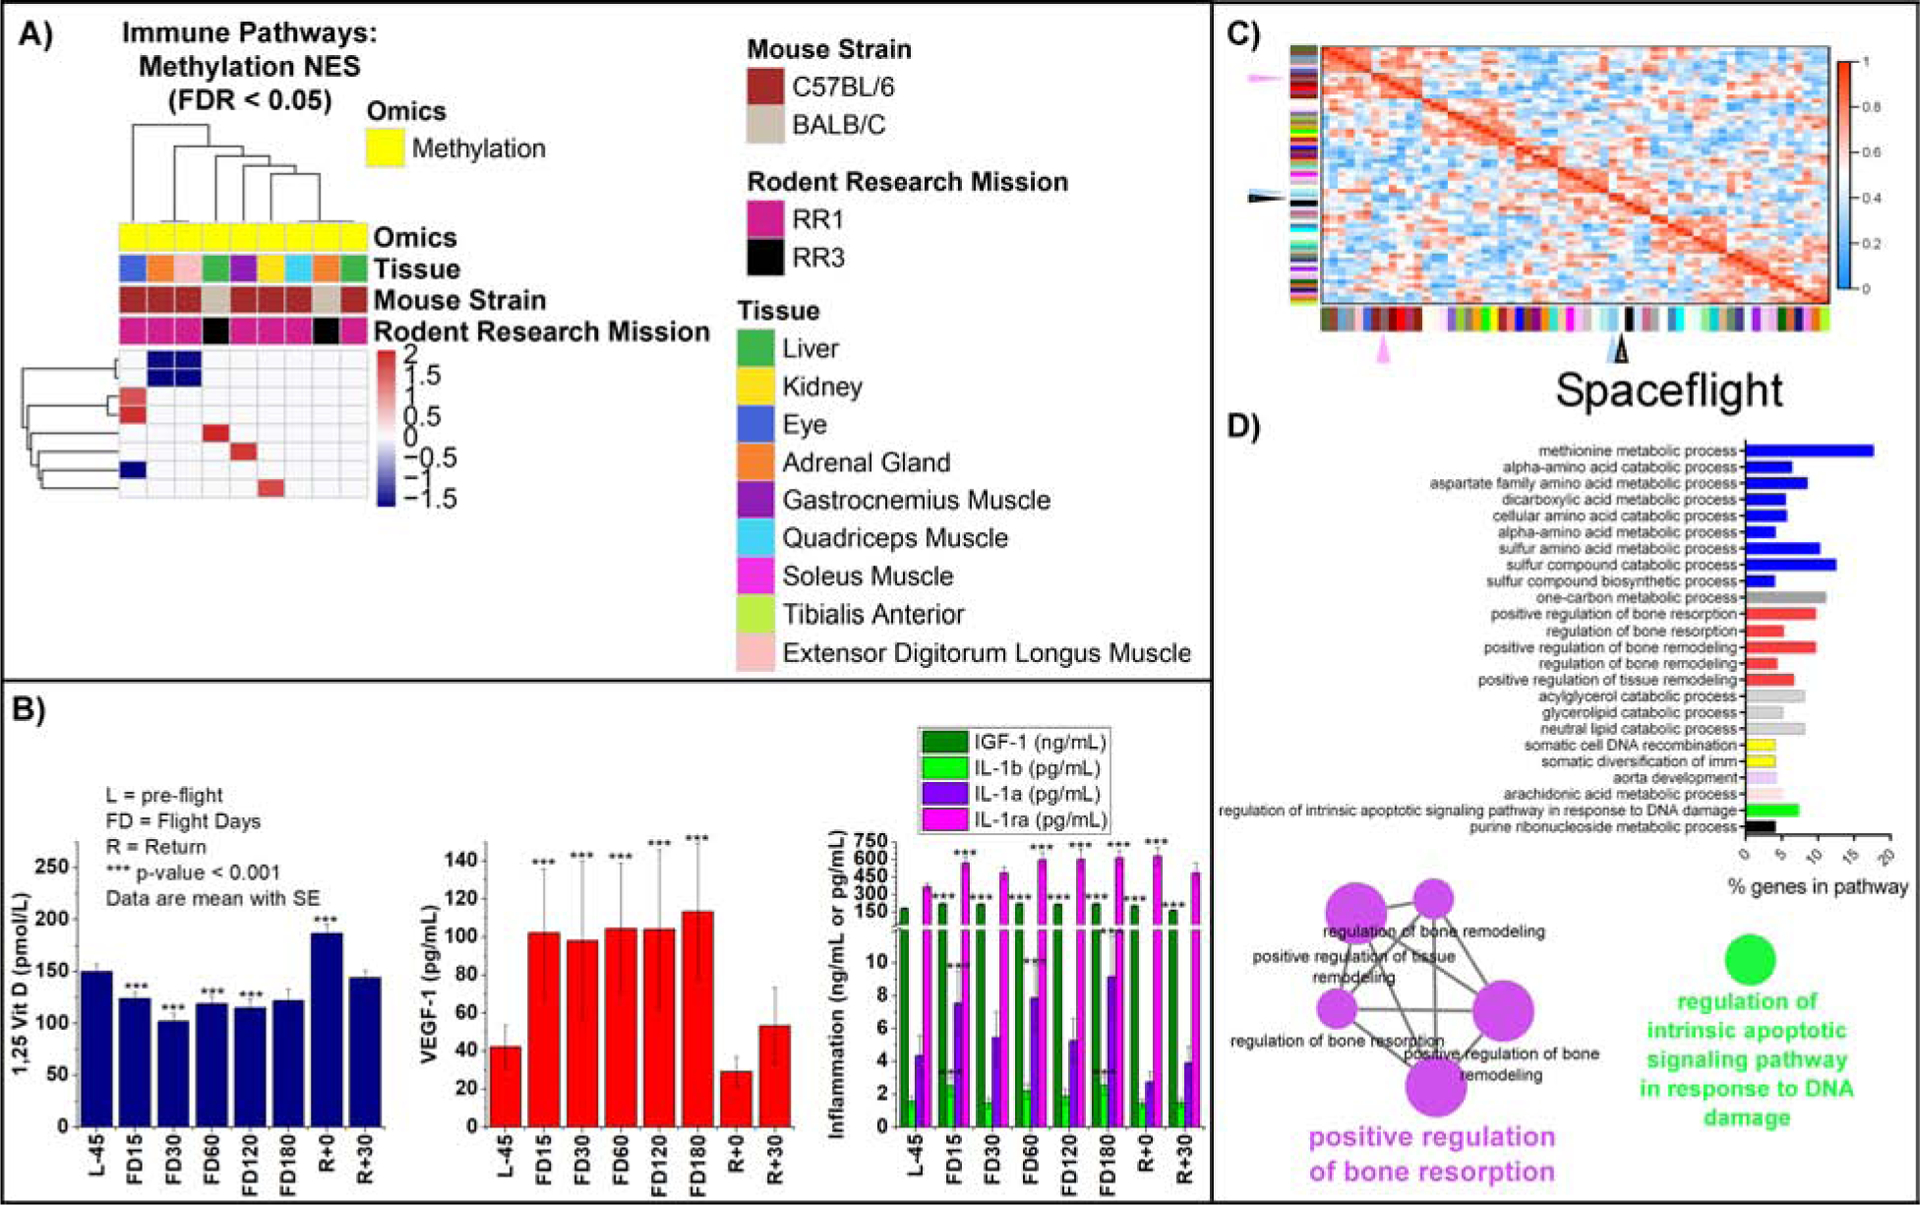
A) Heatmap representation of GSEA analysis on the methylated genes. B) Blood levels of 1,25 Vitamin D, VEGF-1, IGF-1, IL-1a, IL-1b and IL-1ra in astronauts for 59 crewmembers. Details available on analysis in Figure Legend 3F. C) WGCNA heatmap plot with arrows identify key hubs in spaceflight for liver samples. D) GO pathway analysis utilizing ClueGo from the genes identified in the spaceflight correlated WGCNA modules.
Lipid dysregulation and the liver: a centralized role in the spaceflight response
To further understand critical modules or gene hubs regulated by spaceflight, we used a weighted gene co-expression network analysis (WGCNA) on the liver datasets (Langfelder and Horvath, 2008). We focused on the liver since we previously demonstrated that the liver regulates immune activity and lipid dysregulation during spaceflight (Beheshti et al., 2019). We observed two consensus networks significantly correlating with spaceflight in each group (denoted by arrows in Fig. 5C). ClueGO (Bindea et al., 2009) analysis of modules revealed significant enrichment of genes associated with DNA repair and bone resorption and remodeling (Fig. 5D). This enrichment agrees with our findings of reduced 1,25 (OH)2 Vitamin D during spaceflight (Fig. 5B) and also with increased urinary 8-OHdG excretion (Fig. 3C).
The third major grouping of GSEA pathway hits focused on lipid biology. As stated earlier, lipid dysregulation with spaceflight originates from the liver (Beheshti et al., 2019). From our analysis of tissue pathways, lipid metabolism gene sets were upregulated in the liver and kidneys and downregulated in the eyes and adrenal gland (Fig. 6A). Also, the lipid profile in astronauts changed with spaceflight. We found higher levels of total cholesterol and low-density lipoprotein (LDL) cholesterol, accompanied by decreased levels of high-density lipoprotein (HDL) cholesterol. Again, these levels reverted to normal after returning to Earth (Fig. 6B). These results indicate that spaceflight impacts lipid metabolism at the hepatic gene expression level, extending to the circulating lipid profile. We did not assess dietary intake before or after spaceflight. Still, it is worth noting that the spaceflight food system is limited, and astronauts’ diets differ from a nominal (earth based) diet.
Our tissue-specific FBA analysis results on liver tissues from flight versus control mice in both missions identified an increase in fluxes related to carbohydrate and lipid-related metabolic factors (Fig. 6C and Table S7). Several conditions that lead to liver fibrosis are known to be marked by specifically dysregulated metabolic pathways, including significant increases in metabolites involved in glycolysis/gluconeogenesis, fructose and mannose metabolism, tryptophan metabolism, valine, leucine, isoleucine metabolism, glycine, serine, and threonine metabolism, glutathione metabolism, glycerophospholipid metabolism, and tricarboxylic acid (citric acid) cycle metabolism (Chang and Yang, 2019). We found fluxes related to these fibrosis-related pathways significantly increased (p<0.05) in the pathways cited above (Fig. 6C).
Circadian rhythm, olfactory activity, and muscle extracellular matrix (ECM)-related pathways and blood and urine parameters affected by spaceflight in vitro and in vivo
Finally, our multi-omics analysis of spaceflight biology identified a grouping of pathways related to the circadian rhythm, olfactory activity, synapse/receptor signaling, and ECM (Fig. 7, Table S2 and S6). Cell cycle pathways were upregulated in all cell and tissue models except in human T cells, where these same terms were downregulated (Fig. 7A and 7B). Cell cycle dysfunction is heavily involved with all the other pathways discussed below. ECM related pathways were unaltered in the quadriceps, upregulated in SLS, EDL, GST, and TA muscles, and downregulated in the carotid artery (Fig. 7C). Circadian rhythm pathways were upregulated at the transcriptional level in all internal organs but the liver (Fig. 7C), suggesting that spaceflight impacts diurnal patterns of gene expression. Also, circadian rhythm pathways for the methylated genes were upregulated in the quadriceps and adrenal glands (Fig. 7D). Olfactory activity was also upregulated for methylated genes in the eyes, adrenal glands, kidneys, and GST muscle (Fig. 7D). Renin, an enzyme linked to vitamin D and calcium levels, significantly increased in 59 astronauts (Fig. 7E), and increases in renin impact circadian rhythm activity (Ohashi et al., 2017).
Figure 7. Circadian rhythm, olfactory activity and extra-cellular matrix (ECM) related pathways and blood parameters affected by spaceflight in vitro, in vivo, and in astronauts.
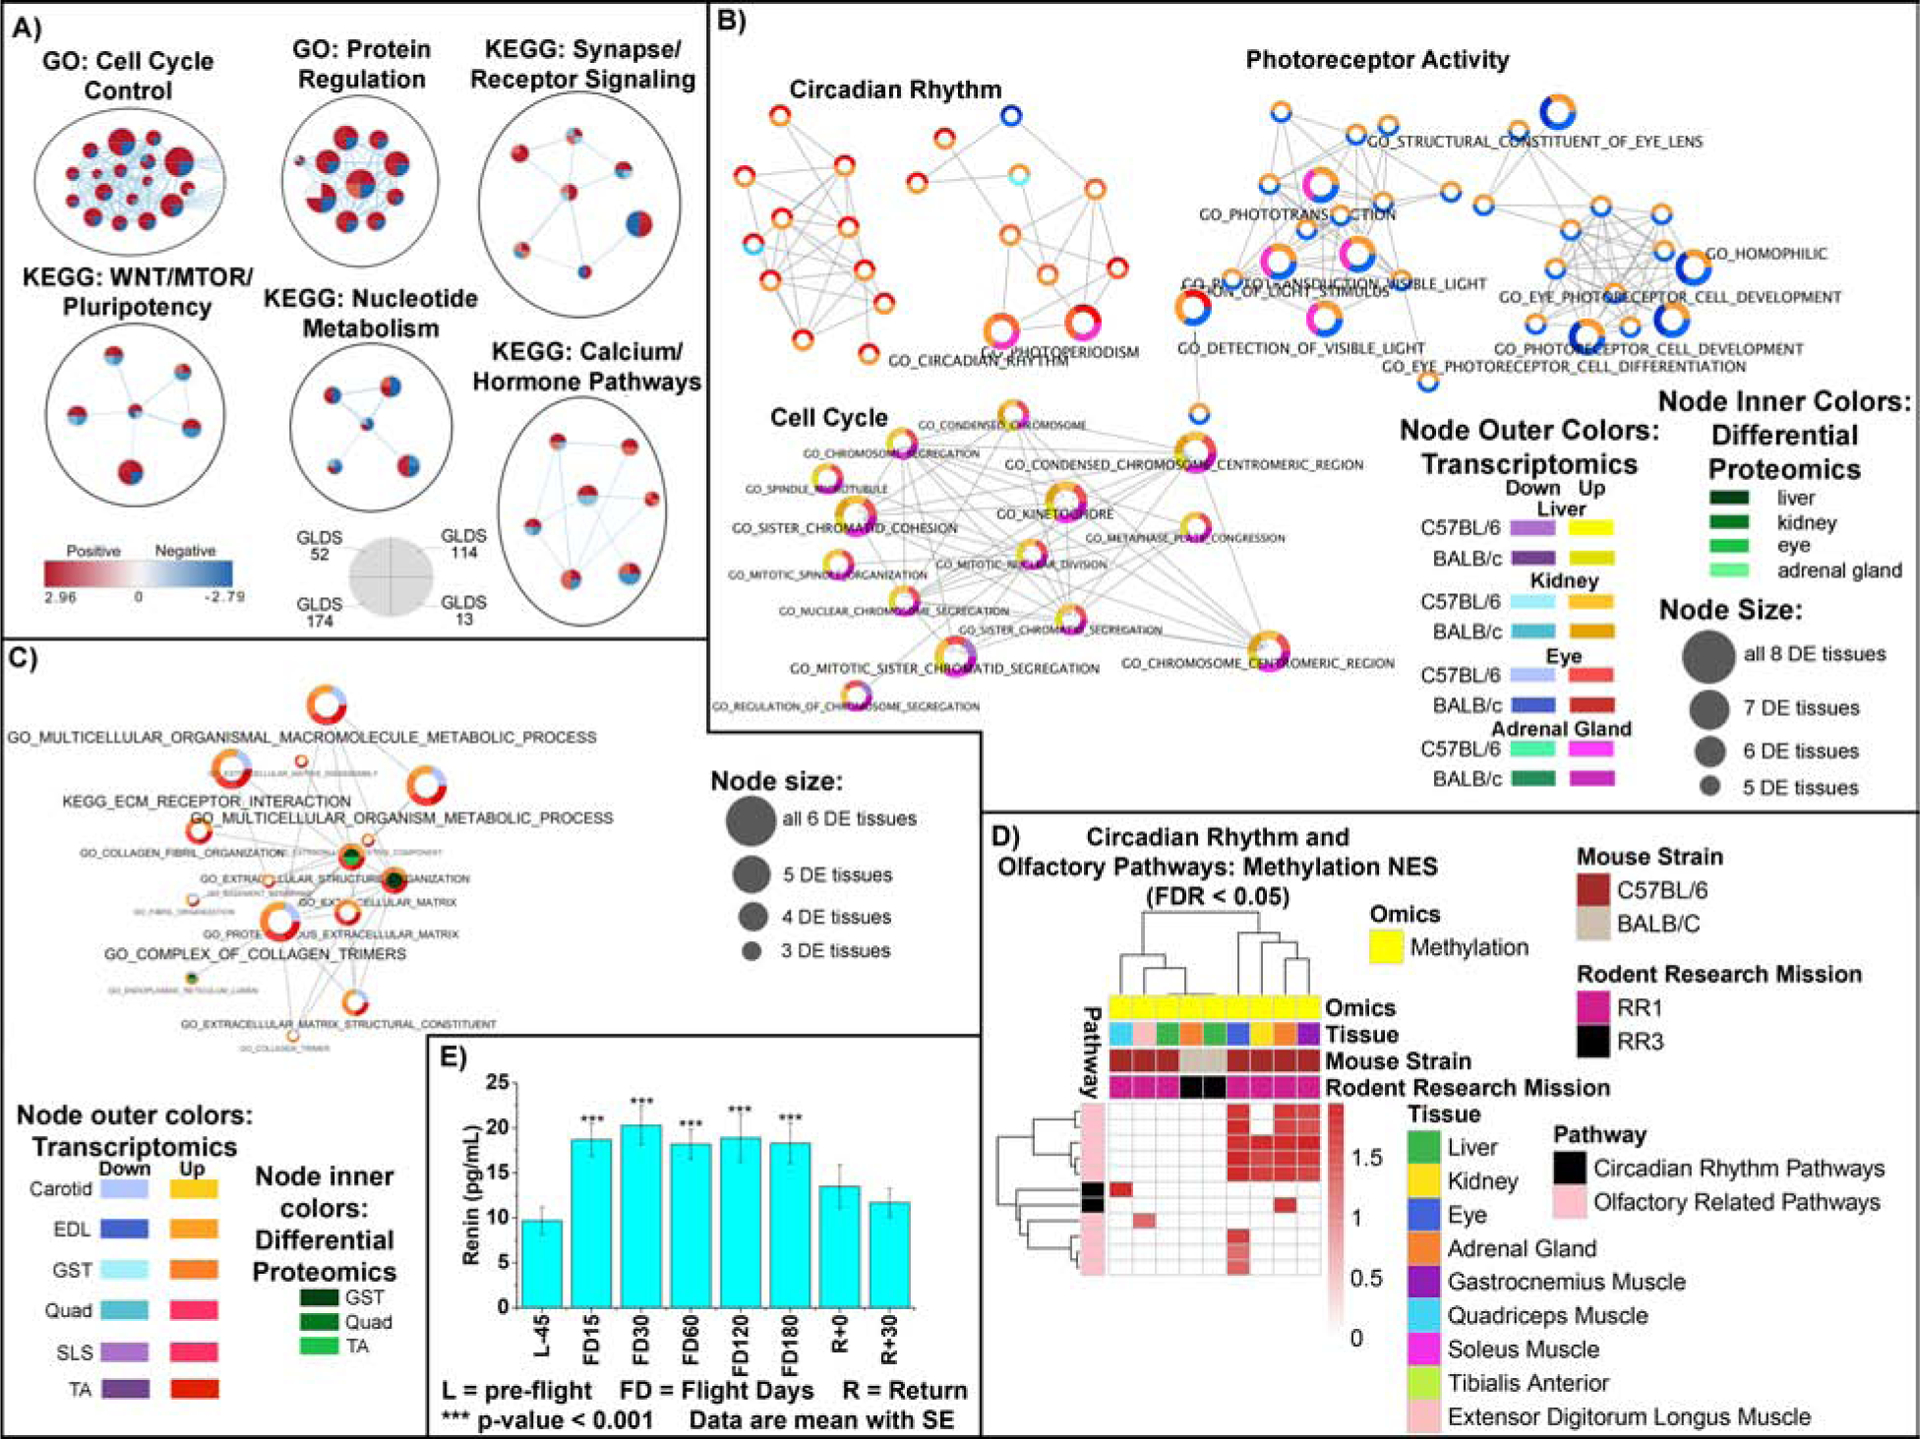
A) Network representation of in vitro datasets on GO and KEGG sets with FDR <10% in at least two GLDS datasets. B) and C) Pathway results were integrated across multiple tissues and RNAseq and proteomics platforms and details for analysis is available in Figure 2B and 2C. D) Heatmap representation of GSEA analysis on the methylated genes. E) Blood levels for renin in astronauts’ blood for 59 crewmembers. Details available on analysis in Figure Legend 3F.
Discussion
Utilizing an integrated, comprehensive, and multi-omics systems biology approach, we have uncovered insights into fundamental biological mechanisms affected by spaceflight. Our analyses suggest systemic shifts in mitochondrial function occur in spaceflight in most of the tissues we examined. Mitochondrial changes likely impact processes such as innate immunity, lipid metabolism, and gene regulation in both mice and humans, and the results from our analyses are consistent with those from previous studies (Beheshti et al., 2019; Suomalainen and Battersby, 2018) and are supported by multiple other omics studies (Bezdan et al., 2020; Gertz et al., 2020). Raising awareness for adverse health outcomes during spaceflight will help guide scientific community responses to mitigate spaceflight associated health risks and develop appropriate countermeasures.
We are not the first to propose changes to mitochondrial activity during spaceflight. Nikawa and collaborators proposed a spaceflight-specific, induced mitochondrial activity alteration associated with muscle atrophy in 2004 (Nikawa et al., 2004). Another study reported decreased mitochondrial activity in the roots of space-flown soybean seedlings (Klimchuk, 2007). Low doses of radiation trigger severe mitochondrial damage (Shimura et al., 2016) and the lower diffusion rates of solutes in microgravity (Smith et al., 2009) reduce the hydrogen gradient at the mitochondrial intermembrane space, reducing electron transport chain and ATP synthesis (Nelson, 2013). Our findings report transcriptomic, epigenetic, proteomic, and metabolomic patterns (Figs. 2 and 3) consistent with mitochondrial stress in different cells and multiple organs, including muscle tissues (Jha et al., 2017; Topf et al., 2019). Specifically, mouse ISS data (Fig. 3B), astronaut studies (Fig. 3F), and the NASA Twin Study data (Fig. 3E) all strongly support an alteration in the electron transport chain reaction and ATP production in the mitochondria. Taken as a body of evidence, this suggests spaceflight induces mitochondrial stress in multiple organisms.
The existence of spaceflight-induced mitochondrial stress is further supported by metabolite studies reporting increased urinary 8-OHdG and prostaglandin F2 alpha. 8-OHdG is a biomarker of cellular oxidative stress related to DNA repair (Wu et al., 2004). Increased prostaglandin F2 alpha levels in urine are associated with oxidative stress and cyclooxygenase independent synthesis (Yin et al., 2007). These markers are consistent with our analysis suggesting mitochondrial stress and dysfunction due to oxidative stress during spaceflight (Figs. 3B, 3F, and 3G). Oxidative stress is critical to mitochondria-mediated disease processes (Wallace, 2013). The longitudinal decrease in antioxidant capacity observed in astronauts during spaceflight (Fig. 3F) agrees with the development of mitochondrial and metabolic impairment dependent on space exposure. Energy homeostasis is of great importance when considering extended duration space missions, such as the possible mission to Mars, that will last at least 560 days (Pecaut et al., 2017). Our context-specific metabolic flux analysis (Fig. 3G) further demonstrates that spaceflight upregulates NAD metabolism in the liver, linking oxidative stress and mitochondrial dysfunction (Massudi et al., 2012). A time-dependent increase in oxidative stress could have cumulative effects on astronaut physiology, including impacts on cognition and the development of impairing conditions that can make the journey unviable without effective countermeasures. Future research is needed to evaluate the long-term consequences of oxidative stress on astronaut health.
Increased oxidative stress and mitochondrial stress were implicated in causing androgenetic alopecia (permanent hair loss) (Ho et al., 2019; Upton et al., 2015). Our analysis from the cell line data shows hair follicles exhibit increased expression of genes related to mitochondrial activity, while other cells show reduced expression (Fig. 2A). Increases in PPARGC1α (PGC1α), similar to what we have observed in the mouse tissue (Fig. 2C), were implicated with androgenetic alopecia through oxidative stress and mitochondrial activity (Ho et al., 2019). PGC1α also interacts with PPARγ, and dysregulation of PPARγ has been shown in hair follicle stem cells (HFSCs) to produce similar results to scarring alopecia (i.e., hair loss disorder) (Karnik et al., 2009). An increase in ROS, as encountered in spaceflight, triggers adult stem cells differentiation, and rapidly switches to mitochondrial OXPHOS (Hamanaka et al., 2013; Ito and Suda, 2014). We hypothesize that the increase in ROS caused by the spaceflight derived mitochondria dysfunction causes the shift from glycolysis to OXPHOS, increasing HFSC mitochondrial activity, and a potential mechanism to explain astronaut hair grown inhibition.
Skeletal muscle also depends on OXPHOS for energy production (Kelley et al., 2002) reported to play a role in regulating metabolism (Argiles et al., 2016; Pratesi et al., 2013). The loss of skeletal muscle alters whole-body metabolism (Argiles et al., 2016). Microgravity-induced muscle degeneration is well reported (Demontis et al., 2017; Nikawa et al., 2004). The reduction of muscle metabolic flux when comparing between FLT vs GC vs the opposite result in liver (Figs. 3G, 6C, and 6D) may be due to the liver’s response to muscle wasting (sarcopenia). Sarcopenia is an independent risk factor for liver fibrosis in non-alcoholic fatty liver disease (NAFLD) cohorts, independent of obesity, inflammation, and insulin resistance (Koo et al., 2017). A recent comprehensive meta-analysis across similar studies found increased risks of NAFLD and liver fibrosis in subjects with sarcopenia (Cai et al., 2020). It is also interesting to note that opposite trends in mitochondrial activity in liver and muscle are common in subjects with prediabetes or diabetes type 2 (Bhansali et al., 2017; Pottecher et al., 2018). We suggest that muscle loss may relate to the increased metabolic flux changes in spaceflight for the mouse liver versus muscle, an area for future research.
Our data indicate an overall dysregulation in lipid metabolism caused by the space environment, with particular attention to the liver being the body’s central metabolic organ and where LDL is produced (Nelson, 2013). We observed lipid metabolism pathways altered in mice and humans exposed to the space environment (Fig. 6). However, since no lipid pathway changes were observed in cell line data, we suggest lipid metabolism changes are derived from complex interactions at the tissue and organ levels. Two mouse strains were previously found to have accumulated lipids in the liver due to spaceflight exposure (Beheshti et al., 2019). Besides, lipid-related metabolic pathways were increased in the liver of the spaceflight mice (Fig 6C). Increased tryptophan, valine, leucine, isoleucine, TCA cycle, sphingolipid, and glycerophospholipid metabolites are reported in the development and onset of fibrosis, with valine and bile acid synthesis related to more advanced stages (Chang and Yang, 2019; Musso et al., 2018). The lipid/glycolytic metabolic flux imbalance occurring in liver for mice flown to space-related to the onset of fibrosis is directly involved with the mitochondrial process, which involves modulation of oxidative phosphorylation (Diamond et al., 2007) (Fig. 3B). Also, inflammation leads to changes in lipid metabolism, and the persistence of the inflammatory stimulus can lead to chronic lipid changes associated with metabolic syndrome (Esteve et al., 2005). Interestingly, mitochondrial dysfunction is both a cause and a consequence of metabolic disorders (Bhatti et al., 2017). Spaceflight induced dyslipidemia in mice and astronauts (Schmidt et al., 2020) can be one contributor to cardiovascular health risks during longer-term space missions (Stein et al., 2019).
It is also well established that cardiovascular risk is related to lipid disorders (Stein et al., 2019) and associations between dysregulation of mitochondrial energy metabolism and poor cardiac health are common (Meyers et al., 2013). The renin-angiotensin system induces hyperpolarization of the inner mitochondrial membrane, culminating in cell death (Siasos et al., 2018). As we found, in the case of renin (Fig. 7E), the hormones in the renin-angiotensin-aldosterone system were reported as increased in spaceflight (Hughson et al., 2018). Early in 2020, the first occurrence of venous thrombosis was reported during spaceflight (Aunon-Chancellor et al., 2020). Limited knowledge exists for the effects of spaceflight on platelets (Vernice et al., 2020). However, mitochondrial dysfunction attenuates platelet survival and increased risk for thrombovascular events (Kunz et al., 2017; Melchinger et al., 2019), increasing stroke risk (Behrouzi and Punter, 2018). Mitochondrial dysfunction may cause stroke-like episodes independent of hypoxia (Ng et al., 2019). Therefore, spaceflight-induced mitochondrial dysfunction could increase cardiovascular disease risk in long-term missions caused by microgravity cardiovascular deconditioning and space radiation (Hughson et al., 2018).
Cardiovascular disease is also linked to mitochondrial dysfunction through proteostasis failure related to lipid accumulation and ROS activity (Alam et al., 2020; Arrieta et al., 2020). Alterations in ribosome assembly, mitochondrial, and cytosol translation pathway in the cell models, internal organs, and muscles (Figs. 2 and 3) suggest the presence of proteostasis failure (Lu and Guo, 2020). Proteostasis refers to the maintenance of the proteome homeostasis by protein synthesis, folding, and degradation. Proteostasis failure occurs in C. elegans in response to spaceflight, although it was not clear if this response was due only to muscle wasting (Honda et al., 2012). Alterations in proteostasis were widespread in our cell models and internal organ tissues (Fig. 2). Mitochondrial dysfunction inhibits cytosolic protein synthesis and defective protein quality control (Lu and Guo, 2020; Topf et al., 2019). Since mitochondrial function can prevent age-related proteostasis collapse (Williams et al., 2020), we suggest countermeasures focused on re-establishing the mitochondrial function will also recuperate the proteostasis condition. Interestingly, proteostasis loss is a hallmark of aged muscles (Fernando et al., 2019).
Lipid metabolism changes can also be caused by inflammation (Esteve et al., 2005) which is related to our observed markers for innate immunity with dysregulation of adaptive immunity occurring during spaceflight, consistent with an increased innate immunity profile on spaceflight (Crucian et al., 2018). The complement system and pathways related to IFN-γ and IFN-α change in the internal organs (Fig. 4B). Mitochondrial debris were observed in blood in the Twin Study (Garrett-Bakelman et al., 2019) and mitochondrial damage-associated molecular patterns (DAMPs) activate innate immune pathways (Banoth and Cassel, 2018; Zhang et al., 2010). We found a similar pattern with IFN-γ, IL-1, and TNF-α up-regulation within muscle tissues and astronaut blood (Figs. 4 and 5B). Interestingly, we also found altered proteasome expression linked to innate immunity (Table S6). IFN-γ can induce a switch to aerobic glycolysis and has a significant role in proteasome regulation (Wang et al., 2018; Yang et al., 1992), linking mitochondrial dysfunction, innate immunity, and alterations in proteostasis. IFN-γ, IL-1, and TNF-α are known to be drivers of muscle wasting in chronic inflammatory diseases (Londhe and Guttridge, 2015). Vitamin D can modulate the innate and adaptive immune responses as the vitamin D receptor is expressed on B cells, T cells, antigen-presenting cells, and dendritic cells (Aranow, 2011). The lower levels of 1,25 Vitamin D and higher IL-1 and IGF-1 levels measured from 59 astronauts are consistent with findings at the cellular and tissue levels (Fig. 5). Adequate energy, protein, and vitamin D supply are essential for bone mineral density maintenance after six months of spaceflight (Smith et al., 2012b). Astronauts had a decrease in 1,25 vitamin D levels (the active form of vitamin D) (Fig. 5B) consistent with other studies (Smith et al., 2005) Vitamin D3 (cholecalciferol) supplementation prevents 1,25 vitamin D loss, leading NASA to increase the vitamin D supplementation to 1000 IU/d (Douglas, 2020). Vitamin D3 is modified through the mitochondria in the liver and kidney to assume its active form, 1,25 vitamin D (Bikle, 2014). Synthetic active vitamin D analogs may not help increase the health risks already associated with spaceflight such as hypercalcemia, kidney stone formation, and ectopic calcification (Nicogossian et al., 2016; Smith et al., 2015).
Immune dysregulation is known to be strongly influenced by the cell cycle (Laphanuwat and Jirawatnotai, 2019). We found that cell cycle-associated genes were affected by spaceflight in both the in vitro and in vivo models (Fig. 7). Spaceflight caused an increased expression of cell cycle genes in fibroblasts, endothelial cells, and the hair follicles, but these genes were down-regulated in T cells (Fig. 7A). Intracellular ROS enhances fibroblasts, endothelial cells, and hair follicles cell proliferation (Day and Suzuki, 2006; Hamanaka et al., 2013). However, ROS causes T cell cycle arrest (Belikov et al., 2015; Yan and Banerjee, 2010) and T cell activation/proliferation requires a reducing extracellular microenvironment (Yan and Banerjee, 2010).
Cell cycle and mitochondrial activity directly control circadian rhythm in cells and organisms (Sardon Puig et al., 2018). Sleep disorders are common in astronauts (Wu et al., 2018) and patients with primary mitochondrial diseases (Ramezani and Stacpoole, 2014). Intriguingly, we have found alterations in circadian cycle on internal organs, particularly in the eyes. In this study, the mice in space and ground control were maintained in a 12/12 light/dark cycle. They were not subjected to any workload activities that commonly impact astronauts, which rules out both possible causes for this alteration. A return to mitochondrial homeostasis could help restore a healthy awake/sleep cycle in astronauts. The methylated genes demonstrated olfactory activity pathways upregulation in multiple tissues (Fig. 7D). The olfactory bulb pathways are closely linked to circadian rhythm affecting feeding times (Pavlovski et al., 2018) and immune functions (Mukhopadhyay et al., 2016). Additionally, mitochondrial Ca(2+) is a critical element in olfactory signaling (Fluegge et al., 2012) and in astronauts, smelling behavior changes occur potentially due to microgravity causing an upward shift of body fluid (Mukhopadhyay et al., 2016). Olfactory signaling has even been directly linked to mitochondrial structure and glucose activity (Kovach et al., 2016), indicating we have uncovered a systemic impact on the body driven by the mitochondria.
G proteins are ubiquitous inside cells and play an essential role in circadian regulation (Doi et al., 2011). They also regulate a wide range of cellular processes, including a significant role in synapse formation and elimination, affecting memory formation (Leung and Wong, 2017; Ye and Carew, 2010). We identified potential alterations in receptor signaling in our cell models due to changes in the expression of several G protein-linked signal transduction genes (Figs. 1A, 4A, 7A, and Table S6). Interesting, G protein-coupled receptor kinase 2 (GRK2) was reported to act as a gatekeeper of mitochondrial function in the heart, and the inhibition of G protein-coupled receptor 35 (GPR35) preserved mitochondrial function after myocardial infarction (Chen et al., 2020; Sorriento et al., 2019). In addition, G proteins are heavily involved with the renin-angiotensin system, with the activation of G proteins resulting in similar increases to the renin levels we observed (Fig. 7E). (Balakumar and Jagadeesh, 2014). The potential of targeting G protein-coupled receptor signaling as a spaceflight countermeasure should be investigated further.
Countermeasures for spaceflight consist of procedures or nutritional and therapeutic interventions to counteract the adverse effects of spaceflight on the human body, maintain health, reduce risk, and improve safety (Clément, 2011). The principal countermeasure applied to astronauts is exercise; astronauts onboard the ISS exercise for up to 2 hours per day, but there is still a considerable decrease in muscle mass, and bone loss observed after landing (Clément, 2011). Exercise also counteracts the effect of microgravity on the cardiovascular system; nonetheless, neither exercise intensity nor duration showed sufficient to prevent vascular changes as increased arterial and intima-media thickness, cardiac atrophy, and the development of insulin resistance (Hughson et al., 2018). A study on acute exercise in individuals with a spectrum of insulin resistance showed that acute physical activity triggers molecular responses on the metabolic and energy-producing pathways, increasing glycolysis, TCA cycle, and fatty acid oxidation (Contrepois et al., 2020). In comparison, our results show an overall decrease in the TCA cycle and fatty acid metabolism in the muscle tissue based on the metabolic flux analysis (Fig. 6D). At the same time, these factors increase in the liver (Fig. 6C), indicating exercise may not be enough to counteract the stressors in space. With exercise currently utilized as an inflight countermeasure, the increases of acute inflammatory markers seen during exercise (e.g., IL-6, TNF-a, IL1-RA, and IGF-1) could be problematic to an already increased inflammatory pattern we measured in astronauts (Fig. 5B), even though these markers are reduced by regular exercise in low-grade systemic inflammation patients (Contrepois et al., 2020; Khazaei, 2012).
In addition to exercise, pharmacotherapy and nutritional interventions used in patients with mitochondrial dysfunction should be considered for future spaceflight countermeasures. An essential aspect of astronauts’ metabolic health is consuming the recommended energy intake consisting of carbohydrates, fats, vitamins, and minerals. The field of nutritional mitochondrial therapeutics is still evolving, with some evidence pointing to effective treatments (Camp et al., 2016; Rinninella et al., 2018). The strongest candidate is the coenzyme Q10 (CoQ10) that should be administered to the majority of primary mitochondrial diseases (PMD), independent of CoQ10 deficiency (Camp et al., 2016). CoQ10 is an abundant lipid-soluble nutrient scavenging free radical and protecting cells against oxidative damage (Zhang et al., 2018). CoQ10 is currently being tested on the ISS as a countermeasure for retinal lesions, and data from this project could help elucidate if CoQ10 could be used as a more general intervention (Lulli et al., 2019).
In summary, the effects of spaceflight on the mitochondria provides a unifying framework for integrating the various alterations observed in the astronauts. Reduced mitochondrial function with sustained calories would generate excess mitochondrial ROS and activate compensatory mtDNA replication, resulting in increased mtDNA transcripts. The combination of replicating mtDNA and ROS would oxidize the mtDNA, which would be released to activate the innate immune system inflammasome and the Type I interferon pathway (West and Shadel, 2017; Zhong et al., 2018). The reduced NADH and radiation-induced DNA damage would reduce NAD+ levels (Fig. 3G), which would impair the circadian rhythm system through perturbed Sirt1 regulation of BMAL acetylation (Nakahata et al., 2008). Alteration in mitochondrial protein production would activate the mitochondrial unfolded protein response (Fig. 7A), which would trigger the integrated stress response pathway (Fig. 3C), causing phosphorylation of the cytosolic initiation factor eIF2α. This would activate the ATF4 transcription factor to upregulate expression of FGF21 and GDF15 and induce the mitochondrial supercomplex assembly factor SCAF1 (Balsa et al., 2019a; Khan et al., 2017a). Finally, inhibiting the electron transport chain (Fig. 3G) would alter the mitochondrial metabolites, which serve as the substrates for the epigenome modification enzymes (Kopinski et al., 2019).
Overall, this work highlights the power of comparing and integrating multiple omics and data types to understand further how life adapts to spaceflight conditions and risks. We found mitochondrial dysregulation as a central hub for space biology. This concept can guide new nutritional and pharmaceutical interventions and studies that will increase the viability of long-term human-crewed space missions. Health effects from mitochondrial dysfunction should be considered with spaceflight health risk models when planning future human-crewed missions to the Moon and Mars.
STAR★Methods
RESOURCE AVAILABILITY
Lead Contact
Further information and request for resources, data and code availability should be directed to the corresponding author Afshin Beheshti (afshin.beheshti@nasa.gov).
Materials Availability
This study did not generate new unique reagents.
Data and Code Availability
The published article includes the WGCNA code generated and analyzed during this study in Methods S1. All other code referred in the Key Resources Table are standard code available through the link and references. The original/source data for all GeneLab datasets (GLDS) in the paper is available on GeneLab (https://genelab.nasa.gov/) with the specific GLDS identifier numbers in the Key Resource Table. The metabolomic data generated for this paper is available on NASA’s GeneLab platform with identifier: GLDS-343 and DOI: 10.26030/h968-2m75.
KEY RESOURCE TABLE
| REAGENT or RESOURCE | SOURCE | IDENTIFIER |
|---|---|---|
| Code | ||
| WGCNA code (Method S1) | This paper | N/A |
| Biological Samples | ||
| Human Blood | NASA Twin Study | http://www.nasa.gov/twins-study/ |
| Human T Cells | ISS Expedition 14 | https://www.nasa.gov/mission_pages/station/expeditions/expedition14/ |
| Human Hair Follicles | ISS Expeditions from July 2009 to February 2013 | https://www.nasa.gov/mission_pages/station/expeditions/past.html |
| Mouse adrenal gland | NASA Rodent Research-1 Mission | https://lsdajsc.nasa.gov/Experiment/exper/13380 |
| Mouse extensor digitorum longus muscle | NASA Rodent Research-1 Mission | https://lsda.lsc.nasa.gov/Experiment/exper/13380 |
| Mouse eye | NASA Rodent Research-1 Mission | https://lsda.isc.nasa.gov/Experiment/exper/13380 |
| Mouse gastrocnemius muscle | NASA Rodent Research-1 Mission | https://lsda.jsc.nasa.gov/Experiment/exper/13380 |
| Mouse kidney | NASA Rodent Research-1 Mission | https://lsda.jsc.nasa.gov/Experiment/exper/13380 |
| Mouse Liver | NASA Rodent Research-1 Mission | https://lsda.jsc.nasa.gov/Experiment/exper/13380 |
| Mouse quadriceps muscle | NASA Rodent Research-1 Mission | https://lsda.isc.nasa.gov/Experiment/exper/13380 |
| Mouse soleus muscle | NASA Rodent Research-1 Mission | https://lsda.jsc.nasa.gov/Experiment/exper/13380 |
| Mouse tibialis anterior muscle | NASA Rodent Research-1 Mission | https://lsdaisc.nasa.gov/Experiment/exper/13380 |
| Mouse adrenal gland | NASA Rodent Research-3 Mission | https://lsdajsc.nasa.gov/Experiment/exper/13961 |
| Mouse eye | NASA Rodent Research-3 Mission | https://lsda.jsc.nasa.gov/Experiment/exper/13961 |
| Mouse kidney | NASA Rodent Research-3 Mission | https://lsda.jsc.nasa.gov/Experiment/exper/13961 |
| Mouse Liver | NASA Rodent Research-3 Mission | https://lsdaisc.nasa.gov/Experiment/exper/13961 |
| Mouse gastrocnemius muscle | NASA Rodent Research-9 Mission | https://lsdajsc.nasa.gov/Experiment/exper/13964 |
| Mouse quadriceps muscle | NASA Rodent Research-9 Mission | https://lsdajsc.nasa.gov/Experiment/exper/13964 |
| Chemicals. Peptides, and Recombinant Proteins | ||
| D-Pantothenic acid acid hemicalcium salt | Sigma Aldrich | P2250 |
| D-Malic acid | Sigma Aldrich | 46940-U |
| a-D-Glucose | Sigma Aldrich | 158968-25G |
| D-Fructose-6-phosphate disodium salt hydrate | Sigma Aldrich | F3627 |
| Citric Acid | Sigma Aldrich | C1857 |
| L-Carnitine hydrochloride | Sigma Aldrich | C0283 |
| L-Arginine | Sigma Aldrich | A5006 |
| Tetradecanoylcamitine (myristoyl-L-carnitine) | Sigma Aldrich | 91582 |
| 4-Nitrobenzoic acid | Sigma Aldrich | 72910 |
| Debrisoquine sulfate | Sigma Aldrich | D1306 |
| Chlorpropamide | Sigma Aldrich | C1290 |
| Acetaminophen | Sigma Aldrich | 103-90-2 |
| Sulfaguanidine | Sigma Aldrich | 57-67-0 |
| Sulfadimethoxine | Sigma Aldrich | 122-11-2 |
| Val-Tyr-Val | Sigma Aldrich | 17355-22-5 |
| Terfenadine | Sigma Aldrich | 50679-08-8 |
| Leu-Enk acetate salt hydrate | Sigma Aldrich | 58822-25-6 |
| Critical Commercial Assays | ||
| micro BCA protein assay | Thermo Scientifc | 23235 |
| Deposited Data | ||
| GLDS-98 | NASA/GeneLab | https://genelab-data.ndc.nasa.gov/genelab/accession/GLDS-98/ |
| GLDS-99 | NASA/GeneLab | https://genelab-data.ndc.nasa.gov/genelab/accession/GLDS-99/ |
| GLDS-100 | NASA/GeneLab | https://genelab-data.ndc.nasa.gov/genelab/accession/GLDS-100/ |
| GLDS-101 | NASA/GeneLab | https://genelab-data.ndc.nasa.gov/genelab/accession/GLDS-101/ |
| GLDS-102 | NASA/GeneLab | https://genelab-data.ndc.nasa.gov/genelab/accession/GLDS-102/ |
| GLDS-103 | NASA/GeneLab | https://genelab-data.ndc.nasa.gov/genelab/accession/GLDS-103/ |
| GLDS-104 | NASA/GeneLab | https://genelab-data.ndc.nasa.gov/genelab/accession/GLDS-104/ |
| GLDS-105 | NASA/GeneLab | https://genelab-data.ndc.nasa.gov/genelab/accession/GLDS-105/ |
| GLDS-161 | NASA/GeneLab | https://genelab-data.ndc.nasa.gov/genelab/accession/GLDS-161/ |
| GLDS-162 | NASA/GeneLab | https://genelab-data.ndc.nasa.gov/genelab/accession/GLDS-162/ |
| GLDS-163 | NASA/GeneLab | https://genelab-data.ndc.nasa.gov/genelab/accession/GLDS-163/ |
| GLDS-168 | NASA/GeneLab | https://genelab-data.ndc.nasa.gov/genelab/accession/GLDS-168/ |
| GLDS-13 | NASA/GeneLab | https://genelab-data.ndc.nasa.gov/genelab/accession/GLDS-13/ |
| GLDS-52 | NASA/GeneLab | https://genelab-data.ndc.nasa.gov/genelab/accession/GLDS-52/ |
| GLDS-54 | NASA/GeneLab | https://genelab-data.ndc.nasa.gov/genelab/accession/GLDS-54/ |
| GLDS-114 | NASA/GeneLab | https://genelab-data.ndc.nasa.gov/genelab/accession/GLDS-114/ |
| GLDS-118 | NASA/GeneLab | https://genelab-data.ndc.nasa.gov/genelab/accession/GLDS-118/ |
| GLDS-174 | NASA/GeneLab | https://genelab-data.ndc.nasa.gov/genelab/accession/GLDS-174/ |
| GLDS-47 | NASA/GeneLab | https://genelab-data.ndc.nasa.gov/genelab/accession/GLDS-47/ |
| GLDS-48 | NASA/GeneLab | https://genelab-data.ndc.nasa.gov/genelab/accession/GLDS-48/ |
| GLDS-343 | NASA/GeneLab | https://doi.org/10.26030/h968-2m75 |
| Experimental Models: Cell Lines | ||
| Fibroblasts AG01522 | Coriell Institute | https://www.coriell.org/0/Sections/Search/Sample_Detail.aspx?Ref=AG01522, RRID: CVCL_H759 |
| HUVEC | ATCC | HUV-EC-C [HUVEC] (ATCC CRL-1730), RRID: CVCL_2959 |
| HMVEC-dBL | LONZA | Catalog Number: CC-2543 |
| Experimental Models: Organisms/Strains | ||
| Mouse: C57BL/6 | Jackson Labs | C57BL/6J (Stock No: 000664) |
| Mouse: BALB/c | Jackson Labs | BALB/c (Stock No: 000651) |
| Oligonucleotides | ||
| Primer. MT-RNR1: Forward - ATGCAGCTCAAAACGCTTAGC | This paper | N/A |
| Primer MT-RNR1: Reverse - GCTGGCACGAAATTGACCAA | This paper | N/A |
| Primer MT-RNR2: Forward - CCCTGTACGAAAGGACAAGAGAAAT | This paper | N/A |
| Primer MT-RNR2: Reverse - TCTTGGGTGGGTGTGGGTATAAT | This paper | N/A |
| Primer: MT-COI: Forward - CAGCAGTCCTACTTCTCCTATCTCT | This paper | N/A |
| Primer MT-C01: Reverse - GGGTCGAAGAAGGTGGTGTT | This paper | N/A |
| Primer MT-C02: Forward - GCCCTTTTCCTAACACTCACAACAA | This paper | N/A |
| Primer MT-C02: Reverse - GTAAAGGATGCGTAGGGATGGG | This paper | N/A |
| Primer MT-ND1: Forward - CCCTAAAACCCGCCACATCT | This paper | N/A |
| Primer MT-ND1: Reverse - GGCTAGAATAAATAGGAGGCCTAGGT | This paper | N/A |
| Primer: 18S rRNA: Forward - GGCCCTGTAATTGGAATGAGTC | This paper | N/A |
| Primer: 18S rRNA Reverse - CCAAGATCCAACTACGAGCTT | This paper | N/A |
| Primer GAPDH: Forward - AAGGTGAAGGTCGGAGTCAAC | This paper | N/A |
| Primer GAPDH: Reverse - GGGGTCATTGATGGCAACAATA | This paper | N/A |
| Software and Algorithms | ||
| FASTQC version 0.11.8 | N/A | https://www.bioinformatics.babraham.ac.uk/projects/fastqc/, RRID: SCR_014583 |
| Trim Galore! Version 0.50 | N/A | https://www.bioinformatics.babraham.ac.uk/projects/trim_galore/, RRID: SCR_011847 |
| STAR version STAR_2.6.1a_08-27 | Dobin et al., 2013 | https://github.com/alexdobin/STAR, RRID: SCR_015899 |
| mice genome version mm 10-GRCm38 | N/A | https://www.ncbi.nlm.nih.gov/assembly/GCF_000001635.20/ |
| RSEM version 1.3.1 | Dobin et al., 2013 | https://deweylab.github.io/RSEM/, RRID: SCR_013027 |
| R Version 3.5.1 and 4.0.2 | R Core Team (2020). | https://www.r-project.org/, RRID: SCR_001905 |
| DESeq2 Version 1.22.2 | Love et al., 2014 | https://github.com/mlkelove/DESeq2, RRID: SCR_01568 |
| Picard MarkDuplicates v2.10.10-SNAPSHOT | N/A | https://broadinstitute.grthub.io/picard/, RRID: SCR_00652 |
| MethylDackel mbias | N/A | https://github.com/dpryan79/MethylDackel |
| methylKit | Akalin et al., 2012 | https://www.bioconductor.org/packages/release/bioc/html/methylKit.html, RRID: SCR_005177 |
| LIMMA | Ritchie et al., 2015 | https://www.bioconductor.org/packages/release/bioc/html/limma.html, RRID: SCR_010943 |
| GSEA | Sergushichev, 2016; Subramanian et al., 2005 | https://www.gsea-msigdb.arg/gsea/lindex.jsp, RRID: SCR_003199 |
| MaxQuant (1.6.2.3) | Tyanova et al., 2016a | https://www.maxquarst.org/, RRID: SCR_014485 |
| Uniprot (downloaded on 20180104) | Tyanova et al., 2016a | https://www.unipfot.org/, RRID: SCR_002380 |
| PTXQC | Bielow et al., 2016 | https://github.com/cbielow/PTXQC |
| Perseus (1.6.2.2) | Tyanova et al., 2016b | https://maxquant.net/perseus/, RRID: SCR_015753 |
| NCI DAVID | Huang et al., 2009 | https://david.ncifcrf.gov/, RRID: SCR_00188 |
| EnhancedVolcano package (Bioconductor) | Ritchie et al., 2015 | http://bioconductor.org/packages/release/bioc/html/EnhancedVolcano.html, RRID: SCR_018931 |
| Cytoscape | Shannon et al., 2003 | https://cytoscape.org, RRID: SCR_003032 |
| ClueGo | Bindea et al., 2009 | http://apps.cytoscape.org/apps/cluego, RRID: SCR_005748 |
| EnrichmentMap | Merico et al., 2010 | http://apps.cytoscape.org/apps/enrichmentmap, RRID: SCR_016052 |
| Progenesis QI | N/A | http://www.nonlinear.com/progenesis/qi/, RRID: SCR_018923 |
| MetaboLyzer | Mak et al., 2014 | https://sites.google.com/a/georgetown.edu/fornace-lab-informatics/home/metabotyzer |
| Gene Expression Dynamics Inspector (GEDI) | Eichler et al., 2003 | RRID: SCR_008530 |
| MetaboAnalyst | Chong et al., 2018 | https://www.metaboanatyst.ca/, RRID: SCR_015539 |
| Python version 3.7.6 and version 3.8.3 | Van Rossum and Drake, 1995 |
https://www.python.org/downloads/release/python-376/ https://www.python.org/downloads/release/python-383/, RRID: SCR_008394 |
| COBRApy version 0.19.0 (using Python 3.8.3) | Ebrahim et al., 2013 | https://pypi.org/project/cobra/, RRID: SCR_01209 |
| Corda version 0.4.2 (for COBRApy) | Schultz and Qutub, 2016 | https://github.com/qutubiab/CORDA |
| imm1415 metabolic model from BiGG (for COBRApy) | Sigurdsson et al., 2010 | https://www.ebi.ac.uk/biomodels/MODEL1507180055 |
| Gurobi Optimizer version 8.1.0 LP (for COBRApy) | Gurobi Optimization. L. L. C. (2020). | https://www.gurobi.com/ |
| Numpy python package v 1.18.1 (with Python 3.7.6) | Harris et al., 2020 | https://njmpy.org/, RRID: SCR_008633 |
| Escher version 1.7.3 (with Python 3.7.6) | King et al., 2015 | http://escher.github.io/#/ |
| pandas 1.0.1 (with Python 3.7.6) | N/A | https://pancas.pydata.org/, RRID: SCR_018214 |
| ipython version 7.12.0 (with Python 3.7.6) | Perez and Granger, 2007 | https://ipython.org/, RRID: SCR_001658 |
| Jupyter Notebook 6.0.3 (with Python 3.7.6) | Kluyver et al., (2016). | https://jupyter.org/, RRID: SCR_018315 |
| pheatmap R package version 1.0.12 | Kolde (2015). | https://github.com/raivokolde/pheatmap, RRID: SCR_016418 |
| bwa-meth version 0.2.2 | Pedersen et al., 2014 | https://github.com/brentp/bwa-meth |
| Kallisto | Bray et al., 2016 | https://pachterlab.github.io/kallito/, RRID: SCR_016582 |
| Other | ||
| GeneLab | NASA | https://genelab.nasa.gov/ |
EXPERIMENTAL MODEL AND SUBJECT DETAILS
Mouse Models
All transcriptomic, proteomic, and methylation data related to the Rodent Research-1 (RR-1) and Rodent Research-3 (RR-3) mission tissues were obtained from NASA’s GeneLab platform (https://genelab.nasa.gov/) from the following dataset identifiers respectively: for RR1 GLDS-98, −99, 100, −101, −102, −103, −104, −105, and −168; for RR3 GLDS-161, −162, −163, and −168. Since these experiments were previously done by others and data is publicly available on GeneLab, all experimental details for these mouse models can be found on GeneLab in the description section for each dataset.
Rodent Research-9 (RR-9) mission tissues were utilized for metabolomic analysis of the medial head of the gastrocnemius, and the quadriceps femoris (“quadriceps”) on male C57BL/6 mice (Jackson Labs) that spent ~34 days in microgravity aboard the International Space Station (ISS) as part of the RR-9 mission in August, 2017, that launched as part of the SpaceX Commercial Resupply Services (CRS)-12 mission. Seven days prior to launch (L-7d), 9-week old mice were grouped as mice to be sent to ISS (Flight; n=10); or ground-based habitat controls placed within in environmental chambers replicating the environmental conditions for the Flight mice aboard ISS (Habitat; n=10). Unberthing from ISS and splashdown of live mice occurred on L+34d, and the live mice were collected by the science teams on L +35d for behavioral and functional testing, as well as tissue harvest. The gastrocnemius and quadriceps remained attached to the left hind limb after removal of the limb from the body by disarticulation at the acetabulum. The femur and tibia were disarticulated, the gastrocnemius was cut at the Achilles tendon, and both muscles remained attached to the femur which was then snap frozen in liquid nitrogen, and then stored at −80°C until tissues were removed for metabolomic analysis.
All animal procedures performed in these experiments were approved by the Institutional Animal Care and Use Committees (IACUC) for flight at the NASA Ames Research Center (ARC) and the Kennedy Space Center (KSC) and the methods were carried out in accordance with relevant guidelines and regulations.
For both RR-1 and RR-3 missions, as stated above we utilized publicly available data available on GeneLab. The authors of this manuscript did not conduct the actual rodent research. Regardless, we have provided the specific details for both of the original experiments for the readers convenience. The following is a description of the for the RR-1 mission, as described on NASA Life Sciences and data archive (https://lsda.jsc.nasa.gov/document/doc_detail/Doc13600): “Twenty adult female mice were launched Sept 21, 2014 in RR hardware within a Dragon Capsule (SpaceX-4) as the flight group (FLT), then after 4 days in transit, were transferred for habitation on the ISS for a total time in space of 37–38 days (10 validation mice), when animals were euthanized and select tissues recovered on orbit. Three control groups at Kennedy Space Center consisted of: 1) Basal mice from the same cohorts as FLT mice euthanized at the time of launch, 2) Vivarium (VIV) controls housed in standard vivarium cages, and 3) Ground Controls (GC) housed in RR flight hardware within an environment chamber that controlled temperature, CO2 and humidity to ISS levels. The health and behavior of all mice on the ISS were monitored by video feed on a daily basis. Mice were euthanized by injection of Euthasol, then either fast frozen intact or dissected to preserve livers (fast frozen) and spleens (RNAlater™). Samples were stored at = −80°C until their return to Earth for later analyses.”
The following is a description of the for the RR-3 mission, as described on NASA Life Sciences and data archive (https://lsda.jsc.nasa.gov/Experiment/exper/13961): “The RR3 payload consisted of twenty female BALB/c mice that were approximately twelve weeks old. The mice were carried to ISS in a transporter aboard SpaceX Commercial Resupply Mission 8 Dragon cargo spacecraft (SpaceX-8, CRS-8). Dragon docked with the station on April 10, 2016 and by April 12 the animals were transferred aboard the station. Once onboard, they were divided into two groups of ten and housed in habitats for six weeks. Approximately one hour of video per day showing animal health and behavior was recorded in each habitat during the mission. Dissections were conducted over four days at thirty-nine to forty-two days in microgravity. Each dissection day consisted of five animals being dissected. Following euthanasia, blood was extracted via cardiac puncture, separated by centrifugation, and frozen. Right hind limbs were dissected and fixed in four percent paraformaldehyde, and carcasses were frozen. The frozen tissue samples were stored in the minus eighty degree freezer (MELFI). Hardware and tissue samples were returned to Earth for recovery and post-flight analyses. Biospecimens were delivered to CASIS.” Ground controls were conducted on a three-day delay at Kennedy Space Center in ISS environmental simulators (ISSESs) programmed with data from the Dragon capsule and the ISS cabin. Based on post-flight analysis of the RR-2 Habitat telemetry data, the ISSESs were programmed to be two degrees Celsius higher than the ISS cabin data; the result of this off-set was that the internal temperatures of the ground control habitats matched the flight Habitats closely for most of the experiment.”
In Vitro Models
All data related to the in vitro experiments were obtained from NASA’s GeneLab platform (https://genelab.nasa.gov/) from the following dataset identifiers: GLDS-13, GLDS-52, GLDS-54, GLDS-114, GLDS-118, and GLDS-174. All detailed information on the cell lines are available on the description for each dataset. Here also will provide a brief description of the cell lines and experiments contained in each dataset. The GLDS-174 data set includes a total of 60 samples from 10 individual astronauts. Six hair follicle samples were collected at six timepoints with two pre-spaceflight, two in-spaceflight and two post-spaceflight. The GLDS-52 data set includes a total of six samples from human umbilical vein endothelial cells (HUVEC). Samples were collected in triplicate for flight or ground treatments. The GLDS-114 data set includes a total of 15 samples from human fibroblasts. The GLDS-118 data set includes a total of 6 samples from human fibroblasts. The GLDS-13 data set includes a total of 6 samples from human T cells. The GLDS-54 data set includes a total of 12 samples from human dermal microvascular endothelial cells (HDMEC). Samples were collected in duplicate at three timepoints (0, 4, and 8 hours) during ground or spaceflight with or without treatment with LPS.
Human data
Data are reported from three human subject experiments conducted on the International Space Station: Nutritional Status Assessment (2006–2012), Dietary Intake Can Predict and Protect Against Changes in Bone Metabolism During Spaceflight and Recovery (Pro K) (2010–2015), and Biochemical Profile (2013–2018). All protocols were reviewed and approved by the NASA Institutional Review Board and all subjects provided written informed consent. While subsets of some of these data have been published in other papers (Crucian et al., 2014; Lee et al., 2020; Smith et al., 2015), as a whole, the data provided here have not been previously published.
Crews from these experiments had missions of 4–6 months in duration, and these studies included blood and urine collections before, during, and after flight, with analysis of an array of nutritional and biochemical markers. Blood and urine samples were collected 2 or 3 times before flight: approximately Launch minus (L-) 180 days and L-45 days. In some cases, a third blood sample was collected (typically along with the L-45 collection), and these tubes were centrifuged and frozen for aliquoting after flight batched with the samples collected inflight. Blood samples were collected inflight, at approximately Flight Day (FD) 15, 30, 60, 120, and 180. Postflight samples were collected in the first 24-h after landing (designated return+0, R+0) and again 30-d later (R+30). The R+0 samples were not necessarily fasting, given the time of day and nature of return from flight. Of the 59 crewmembers reported herein: 8 returned on the Space Shuttle, with blood collection 2–4 hours after landing; 51 landed in Kazakhstan, with 7 of them returning to Star City, Russia, with blood collection 8–10 hours after landing; 44 were transported directly back to the Johnson Space Center in Houston, with blood collection approximately 24-h after landing. Pre and postflight collections included two 24-h urine collections, and inflight collections included one 24-h urine collection. These collection techniques have been previously described (Smith et al., 2012a; Zwart et al., 2011).
We report here vitamins and metabolites, oxidative stress and damage markers, inflammatory markers and cytokines, liver enzymes and endocrine indices. These were analyzed using standard techniques as reported previously (Crucian et al., 2014; Zwart et al., 2016; Zwart et al., 2013; Zwart et al., 2009).
As of this writing, data were available for 59 crewmembers (47 male, 12 female). Age at launch was 47.0 ± 5.6 y, body mass at launch was 79.2 ± 11.8 kg (M: 83.3 ± 9.3; F: 63.0 ± 4.5). Body mass index was 25.5 ± 2.9 kg/m2 (M: 26.4 ± 2.6; F: 22.3 ± 1.5).
All available data are reported here, although the reported n for any given test or session varies for a number of reasons, including: not all experiments had all analytes included, mission length differences for some crewmembers, schedule or other issues occasionally precluded sample collection, and methods changes over time. Repeated measures analysis of variance was conducted to test for differences during and after flight compared to preflight, and comparisons among time points were made using a Bonferroni t-test. Multiple comparisons were accounted for, and only those tests with p<0.001 are reported.
METHOD DETAILS
RNA-sequencing, DNA methylation, and Proteomics
For all RNA-sequencing, DNA methylation, and proteomics datasets being utilized for this manuscript the data was gathered from the GeneLab platform. All information and details for sample preparation, library construction, and sequencing is available in the descriptions for that particular GeneLab dataset and the GLDS identifier is available in the Key Resource Table.
RNA-sequence on Twin Study Samples
Longitudinal samples were collected from a male astronaut aboard the International Space Station and his identical twin on Earth during a 340 day mission including 6 months preflight and 6 months postflight follow-up, for total of 19 timepoints for the flight subject and 13 timepoints for the ground subject. Blood was collected using CPT vacutainers (BD Biosciences Cat # 362760) per manufacturer’s recommendations. For full details of sample separation, processing see (Garrett-Bakelman et al., 2019). Briefly, samples collected on ISS were either frozen in −80°C after separation of mononuclear cells by centrifugation (referred to as CPT), or returned to Earth in 4°C in a Soyuz capsule and sorted into CD4, CD8, CD19 populations and a lymphocyte depleted (LD) fraction. Samples collected on Earth were either frozen for mononuclear cells or processed when fresh for sorted cell populations. To correct for the effects of ambient temperature exposure on RNA (approximately 36 hours including landing and repatriation) control samples were created by simulating similar conditions to those that may occur during the ambient return and were compared to fresh blood collections from the same individual. RNA extraction, library prep and sequencing were completed per (Garrett-Bakelman et al., 2019) using both ribodepletion or polyA selection kits.
Metabolomic profiling
All reagents were of LC-MS grade. Approximately 10 mg of tissue from RR9 (gastrocnemius and quadricep, habitat and flight) were added in a siliconized microcentrifuge tube, followed by addition of 300 μl of chilled 50%:50% methanol:water, containing 4 μM debrisoquine sulfate, 30 μM 4-nitrobenzoic acid, and 5 μM chlorpropamide as internal standards. All samples were randomized. The tissues were homogenized, followed by sonication for 10 sec. 10 μl was removed for protein quantification through a micro BCA assay (Thermo Scientific). Samples were centrifuged for 15 min at 15,000 rpm at 4°C and the supernatant was transferred to a clean siliconized microcentrifuge tube. Chilled 50%:50% acetonitrile:water (300 μl) was added to the pellet and vortexed thoroughly. Following a 15 min incubation on ice, samples were centrifuged again and the supernatant combined with the one previously obtained. The samples were vacuum dried and resuspended in 200 μl of 50%:50% methanol:water, without internal standards, and vortexed thoroughly. Samples were further filtered through a 0.2 μm filter and subsequently transferred to a glass mass spectrometry vial. 2 μl of each sample was injected in a BEH C18 column, 130 Å, 1.7 μm at 60°C and analyzed with a Waters Ultra Performance Liquid Chromatography (UPLC) system coupled to a time-of-flight Xevo G2S mass spectrometry (MS) instrument, operated in MSE mode. The chromatographic and MS conditions are presented in Table S4. A quality control sample was also generated by pooling together 5 μl from each sample, injected every 10 samples. Initial mass accuracy was determined with a metmix mixture of 6 chemicals that ionize in both modes (acetaminophen, sulfaguanidine, sulfadimethoxine, Val-Tyr-Val, terfenadine, and leucine enkephalin). Mass correction and accuracy was achieved throughout the whole run with intermittent injections of leucine enkephalin as LockSpray™. Positive identification of candidate metabolites was performed through tandem mass spectrometry (MS/MS) with ramping collision energy 10–40 eV with pure chemicals and cross-validation of MS/MS spectra through METLIN or HMDB (spectra shown in Figs. S4–S6). All raw data is available on NASA’s GeneLab platform with identifier: GLDS-343 and DOI: 10.26030/h968-2m75.
Real-time PCR (rtPCR) on NASA Twin study samples
A summary of the samples used for the rtPCR analysis is found in Table S5. The whole-blood cell fractions (CPT) was used for isolating RNA and rtPCR. 100ng RNA per sample was reverse transcribed using the iScript Advanced cDNA synthesis kit (Bio-Rad) as per manufacturer’s instructions. The synthesized cDNA was diluted 1:4 in water and quantitative PCR was performed in triplicate with the Power SYBR Green PCR master mix (Thermo-Fisher) using the QuantStudio 6 Flex RT-PCR system. The sequences of primers used for RT-qPCR were:
MT-RNR1: F - ATGCAGCTCAAAACGCTTAGC; R - GCTGGCACGAAATTGACCAA
MT-RNR2: F - CCCTGTACGAAAGGACAAGAGAAAT; R - TCTTGGGTGGGTGTGGGTATAAT
MT-CO1: F - CAGCAGTCCTACTTCTCCTATCTCT; R - GGGTCGAAGAAGGTGGTGTT
MT-CO2: F - GCCCTTTTCCTAACACTCACAACAA; R - GTAAAGGATGCGTAGGGATGGG
MT-ND1: F - CCCTAAAACCCGCCACATCT; R - GGCTAGAATAAATAGGAGGCCTAGGT
18S rRNA: F - GGCCCTGTAATTGGAATGAGTC; R - CCAAGATCCAACTACGAGCTT
GAPDH: F - AAGGTGAAGGTCGGAGTCAAC; R - GGGGTCATTGATGGCAACAATA.
QUANTIFICATION AND STATISTICAL ANALYSIS
In vitro microarray data analysis
Background correction and quantile normalization, differential gene expression was performed using LIMMA (Ritchie et al., 2015). All the datasets were compared with “Flight vs Ground Control” samples. The product of the log10(p-value) and fold change were used to create a preranked gene list for Gene Set Enrichment Analysis (GSEA) (Subramanian et al., 2005). Pathway analysis was performed using GSEA and gene sets were visualized using the EnrichmentMap plugin (Merico et al., 2010) for Cytoscape (Shannon et al., 2003).
RNA-sequencing, DNA methylation, and Proteomics
For all RNA-sequencing, DNA methylation, and proteomics datasets being utilized for this manuscript the data was gathered from the GeneLab platform. All information and details for sample preparation, library construction, and sequencing is available in the descriptions for that particular GeneLab dataset.
RNA-sequence Data Analysis on Murine Samples
RNASeq Analysis included 1) data validation and quality control with FASTQC and Trim Galore!, 2) read alignment to the mice genome using STAR RNA-seq aligner (Dobin et al., 2013), and 3) generation of gene-level expected count data with RSEM (Dobin et al., 2013). The list of software and its versions is as follow: FASTQC version 0.11.8, Trim Galore! Version 0.50, STAR version STAR_2.6.1a_08–27, mice genome version mm10-GRCm38, RSEM version 1.3.1. The quality of the sequencing step was evaluated with FASTQC, Trim Galore was used to pre-process the expression data trimming Illumina standard adapters sequences and nucleotides with a quality phred score below 33. For Differential Expression (DE) analysis, R Version 3.5.1 and DESeq2 Version 1.22.2 (Love et al., 2014) were used. Expected counts from RSEM step were extracted and rounded up to the next integer and used as input for DE analysis. A gene was considered differentially expressed with an adjusted p-value of less than 0.05 when using the Benjamini-Hochberg multiple testing adjustment procedure for false discovery rate (FDR) corrections.
WGCNA Analysis on GLDS-168 Liver Tissue
Count data used for Deseq2 analysis were prepared for WGCNA by normalizing using the TMM method in NoiSeq. WGCNA was then performed on the expression data, using Pearson correlation. Modules were then correlated against radiation status. Significant modules were then extracted and subjected to topGO gene enrichment analysis. A detailed R script for the WGCNA procedure is included in the supplementary methods (Method S1).
RNA-sequence Data Analysis on Twin Study Samples
Generated sequences were trimmed using Trim Galore! (v0.4.1) and quantified to genes using kallisto on ENSEMBL transcripts (Bray et al., 2016). Differentially expressed genes were called using DESeq2 on each cell type separately by comparing preflight, inflight and postflight groups, controlling for the normal biological variance within the 24 months using the longitudinal data of the ground twin and using the simulated ambient control samples as another covariate for sorted cells (Love et al., 2014). Mitochondrial specific analysis on the Twin Study RNA-seq was done by finding the overlapping significantly regulated genes (FDR < 0.05) to mitochondrial genes determined from MitoCarta (Calvo et al., 2015). Heatmap was displayed using pheatmap (Kolde, 2015).
Methylation Data Analysis
Raw DNA methylation data was retrieved from the NASA GeneLab Data System (“GLDS”) website for all datasets that contained whole genome bisulfite data (GLDS-47, 48, 98, 99, 100, 101, 102, 103, 104, 105, 137, 161, and 163). Each sample was aligned using bwa-meth version 0.2.2 (Pedersen et al., 2014) with default settings against an in silico bisulfite-converted mm10 Mus musculus reference genome. Alignments were de-duplicated using Picard MarkDuplicates v2.10.10-SNAPSHOT with default settings (Thomer et al., 2016). MethylDackel mbias (Ogoh et al., 2018) was used on each sample to determine regions of inclusion for each aligned read, in order to correct for methylation bias at the ends of reads. MethylDackel extract was then implemented using mBias-informed inclusion parameters to calculate per-base methylation. Finally, for each methylation call set, strands were merged using MethylDackel mergeContext and a minimum 10x coverage threshold was implemented per CpG.
Differentially methylated CpGs (DMCs) between the “flight” and “ground” samples were called for each dataset using methylKit (Akalin et al., 2012) with a logistic regression model. CpGs that had SLIM adjusted p-value of less than 0.05 were taken as significant (Wang et al., 2011). Further, differentially methylated genes were identified by taking the median methylation around the promoter of each gene (transcription start site ±250bp), converting it to a M-value by logit function transform, and using limma (Ritchie et al., 2015) to call statistical significance. Genes with adjusted p-value of less than 0.05 were taken as significantly differentially methylated. For gene set enrichment analysis these genes were ranked by the degree of methylation difference (log2 fold-change of the M-values) from hyper-methylated to hypo-methylated and were used as inputs to GSEA (Sergushichev, 2016; Subramanian et al., 2005) using MSigDB and MGI phenotypes signature databases (Finger et al., 2017; Liberzon, 2014; Liberzon et al., 2011; Smith et al., 2018) (Figs. 1, 2D, 5A, 7D and Table S3). Relationship between absolute methylation and expression was calculated by taking the base median expression for all genes in each dataset and correlating it to the median promoter methylation of that gene. Significance of the relationship between the methylation change and expression change was calculated by taking the log2 fold-change values for gene expression and methylation and fitting a linear model.
Protein identification, quantification, and data analysis
Peptide and protein identification and quantification was performed with MaxQuant (1.6.2.3) (Tyanova et al., 2016a) using a mouse reference database from Uniprot (downloaded on 20180104) (Tyanova et al., 2016a). The type of experiment was set to Reporter ion MS3 with 10plex TMT labeling. Propionamide of Cys was defined as a fixed modification and Oxidation of Met and Acetylation of protein N-terminal were set as variable modifications. Trypsin/P was selected as the digestion enzyme, and a maximum of 3 labeled amino acids and 2 missed cleavages per peptide were allowed. The False Discovery Rate for peptides and proteins were set at 1%. Fragment ion tolerance was set to 0.5 Da. The MS/MS tolerance was set at 20 ppm. The minimum peptide length was set at 7 amino acids. The rest of the parameters in MaxQuant were kept as default. The generated results by MaxQuant was further processed by PTXQC for quality control analysis (Bielow et al., 2016). Perseus (1.6.2.2) (Tyanova et al., 2016b) and in-house R scripts were used for proteomics data processing and statistical analysis (Tyanova et al., 2016b). The corrected reporter intensity values generated by MaxQuant were used to analyze the TMT-based proteomics data. Protein groups containing matches to decoy database or contaminants were discarded. Total ion intensity for each reporter ion channel were calculated and matched to correct for the sample loads in each TMT experiment. Only proteins that were quantified in the pooled samples were used for the analysis. Subsequently, internal reference scaling (IRS) method was employed to normalize protein intensities between different TMT runs using common proteins in pooled internal standards (Plubell et al., 2017). The data was log2 transformed and scaled by subtracting the median for each sample. LIMMA was employed to determine differentially protein abundance between groups and volcano plots were generated using EnhancedVolcano package (Bioconductor) to visualize the affected proteins (Ritchie et al., 2015). The affected proteins with p-value of less than 0.05 and log fold change of greater than 1.0 or less than −1.0 were considered significant. Differentially abundant proteins (with p-value < 0.05) were selected for GO term and KEGG pathway enrichment analysis using NCI DAVID (Huang da et al., 2009). The categories with p-value of 0.05 or less were considered as significant. Top 4 most significant GO terms and KEGG pathways for each sample were reported in the text.
Gene Set Enrichment Analysis
Count data from datasets GLDS-161, GLDS-162, GLDS-163 and GLDS-168 described above were annotated to gene symbols, Rounded-up for the next integer and normalized by the variance stabilizing variation method using DEseq2 version 1.20.0 and R version 3.5.1. All the datasets were compared with “Flight vs Ground Control” samples, the ranked list of genes were defined by the signal-to-noise metric, and the statistical significance were determined by 1000 permutations of the genesets (Subramanian et al., 2005). Genesets using Gene Ontology terms - Biological Process, Molecular Function and Cellular Component - and KEGG pathways were run separately (Ashburner et al., 2000).
Network maps for cross-omics and cross-tissue analysis
Pathway results were integrated across multiple tissues and RNAseq and proteomics platforms to summarize the system-wide effects of spaceflight compared to ground control. Enriched GO terms and KEGG pathways were integrating using a network framework, where two pathways are connected by an edge if they share a significant fraction of genes (similar to EnrichmentMap). Pathways dysregulated in two or more tissues are displayed. Pathway up and down regulation is encoded by node color, and pathways dysregulated by multiple tissues are mapped to larger node size.
Metabolomic profiling and analysis
Chromatographic deconvolution was conducted with the software Progenesis QI, which also allowed for normalization of the data with the function “normalize to all compounds” (http://www.nonlinear.com/progenesis/qi/v2.0/faq/how-normalisation-works.aspx). Statistical analysis for potential biomarker identification was conducted with the software MetaboLyzer (Mak et al., 2014). Complete presence ions with a ≥75% presence in both control (habitat) and experimental (flight) group were analyzed with the non-parametric Mann Whitney U test, while samples with <75% presence with the Barnard’s test. Outliers were removed via 1.5 IQR base filtering, zero abundance values were removed from the analysis, and a false discovery rate (FDR) of <0.1 was applied. Putative identities were assigned through the databases Human Metabolome Database (HMDB) and Kyoto Encyclopedia of Genes and Genomes (KEGG) (Kanehisa et al., 2014) with <10 ppm error (Table S4). Graphical representation of putative biomarkers was conducted through GraphPad Prism and p-values were calculated with one-way ANOVA testing with Tukey’s multiple comparisons testing. All data are represented as scatter plots, with mean±standard error of the mean (SEM). A p<0.05 was considered statistically significant. Pathway enrichment was conducted through the software MetaboAnalyst (Chong et al., 2018). Self-organizing maps (SOMs) were constructed with the software Gene Expression Dynamics Inspector (GEDI) (Eichler et al., 2003).
Metabolic modeling and downstream statistical analyses
Tissue-specific metabolic models per sample were generated with Corda (Schultz and Qutub, 2016) on the selected tissue data with global flux confidence parameters determined by minimizing within-group flux standard deviation: (40, 10, 50, 0, 0). Flux balance analysis (FBA) was performed in a Jupyter Notebook 6.0.3 (with Python 3.7.6) environment (Kluyver et al., 2016) with the cobrapy package (Ebrahim et al., 2013) on the imm1415 metabolic model (Sigurdsson et al., 2010) optimizing for NAD biosynthesis using Gurobi solver as LP (Gurobi Optimization, L. L. C. (2020). Gurobi Optimizer Reference Manual. http://www.gurobi.com). Specifically, the capacity of NAD biosynthesis through all pathways in mouse is simulated by optimizing the flux of the cytosolic NAD demand reaction in the iMM1415 model(Chowdhry et al. 2019 and Liu et al 2018). In order to include reactions that may not be completely represented from the transcription data, we required the model to include essential pathways ‘Oxidative Phosphorylation’, ‘ROS Detoxification’,’Glycolysis/Gluconeogenesis’, ‘Citric Acid Cycle’,’CoA Biosynthesis’,’CoA Catabolism’,’Biomass and maintenance functions’,’NAD Metabolism’,’Fatty Acid Metabolism’,’Fatty acid activation’,’Fatty acid elongation’, and ‘Fatty acid oxidation’. All metabolic models were analyzed using these identical parameters, except for the transcriptional data input per sample.
Results from the FBA analyses on each sample were reported as fluxes that were then analyzed as grouped variables between the flight (FLT) and ground control (GC) groups. Flux heatmaps using row-wise Z-scores on the FBA results are shown for liver (Figs. 3G and 6C) and muscle (Figs. 3G and 6D). Fluxes in FLT and GC groups were compared using the non-parametric Van der Waerden (VdW) test as we cannot assume normality nor equality of variance between the groups, using the R matrixTests package (v. 0.1.9). Resulting VdW p-values were not adjusted for multiple testing correction because of the likelihood of over-penalization of strongly dependent fluxes in and between pathways. P-values were considered as significant at p < 0.05 (black squares in Fig. 6) and suggestive at 0.05 < p < 0.1 (grey squares in Fig. 6). Data and scripts related to the post-FBA statistical analyses can be found at https://osf.io/utmwf/. Flux levels and results from statistical analyses per flux can be found in the Supplementary Materials (Table S7).
Quantitative Response to Spaceflight - Global view of the data
For each assay, the overall average level of up and down regulated molecules across all species and strains was computed and use to normalize the individual levels of up and down regulated gene/protein/small molecules (metabolome) by dividing by the average of each assay. Note that regulation here refers to comparing Flight samples versus Ground samples, and thus reflects changes happening in space. For example, Liver data were recorded for both RR1 (C57BL/6) and RR3 (Balb/C) missions for both proteomics and transcriptomics. Thus, the reported value for liver for up-regulation is the average expression measured for liver in both lineages divided by the total average level of gene or protein expression reported here across both strains of mice. Such approach gives an overall view of the various dataset simplifying the identification of tissue systematically up or down regulated for individual assays across all assays, without suffering from absolute regulation levels which vary greatly between assays. Specifically, for the analysis for Figs 1A and B we listed the average number of genes/proteins/metabolome that were up or down regulated across all tissue listed. For example, on average, there were 106 and 37 Proteins up and down regulated respectively, with an overall average of 71. The plotted values are normalized to the overall average (i.e. 71). For example, for gene expression, there is an average of 974 genes regulated (average up: 969, average down: 980). In the case of human fibroblasts, values for either up or down regulated genes were about 5, which implies 5 × 974 genes = 4870 genes for each direction. In contrast, a value of 0.574 and 0.845 for up and down for T cells was found, corresponding to 0.574 × 974 = 560 and 0.845 × 974 = 833 respectively. Such scaling was necessary to show the relative amount of changes between tissue and across all assay, without suffering from very distinct level of expression between assays. In the case of protein, we reported the average number of proteins being detected for all groups. Across all tissues, on average across tissue, we had 2980 proteins and 27109 genes detected. Thus, 969 up regulated genes correspond to 3.6% of all detected genes and 37 down regulated proteins corresponds to 1.3% of all detected proteins.
Supplementary Material
Figure S1. Multi-omics and cross-tissue pathway analysis on data from mice flown in space, related to Figures 2B, 4B, 6A, and 7B. Complete set of pathway results were integrated across multiple tissues and RNAseq and proteomics platforms to summarize the system-wide effects of spaceflight compared to ground control. Enriched GO terms and KEGG pathways were integrating using a network framework, where two pathways are connected by an edge if they share a significant fraction of genes. Pathways dysregulated in two or more tissues are displayed. Pathway up and down regulation is encoded by node color, and pathways dysregulated by multiple tissues are mapped to larger node size.
Figure S2. Spaceflight mice muscle metabolomics, related to Figure 3A. A) GEDI self-organizing maps showing global metabolomic shifts due to the effects of spaceflight. B) Carnitine and malate levels with their theoretical fragmentation spectra from Progenesis QI. Levels are depicted as mean ± standard error of the mean. * p<0.05, ** p<0.01.
Figure S3. Multi-omics and cross-tissue pathway analysis on data from mice flown in space, related to Figures 2C, 4C, and 7C. Complete set of pathway results were integrated across multiple muscles and RNAseq and proteomics platforms to summarize the system-wide effects of spaceflight compared to ground control. Enriched GO terms and KEGG pathways were integrating using a network framework, where two pathways are connected by an edge if they share a significant fraction of genes. Pathways dysregulated in two or more tissues are displayed. Pathway up and down regulation is encoded by node color, and pathways dysregulated by multiple tissues are mapped to larger node size. Muscle name legend: Carotid Artery (Carotid), Gastrocnemius Muscle (GST), Quadriceps Muscle (Quad), Soleus Muscle (SLS), Tibialis Anterior Muscle (TA), Extensor Digitorum Longus Muscle (EDL).
Figure S4. MS/MS spectra of A) Carnitine, B) L-Arginine, and C) Tetradecanoylcarnitine (myristoylcarnitine) by comparing fragmentation patterns of QC’s with fragmentation patterns of pure chemicals, related to Figure 3A.
Figure S5. MS/MS spectra of A) Glucose, B) Malic acid (malate), C) fructose-6-phosphate, and D. citric acid by comparing fragmentation patterns of QC’s with fragmentation patterns of pure chemicals, related to Figure 3A. Fragments for glucose were matched to those in the database HMDB.
Figure S6. MS/MS spectra of pantothenic acid with zoomed in regions, related to Figure 3A. All fragmentation patterns in the QC were compared to fragmentation patterns of a pure chemical.
Figure S7. Significant changes in flux pathways displayed on carbohydrate-related metabolic pathways in muscle using an adapted version of the visualization Escher package, related to Figures 3G and 6D. Colors on the thicker width flux lines indicate the mean difference between the fluxes from flight versus ground control mice in both tissues. Narrow faded grey lines are fluxes either not significant or not present in the model results. Data displayed is the same flux data shown in the heatmaps in Fig.3 and Fig 6.
Figure S8. Significant changes in flux pathways displayed on carbohydrate-related metabolic pathways in liver using an adapted version of the visualization Escher package, related to Figures 3G and 6C. Colors on the thicker width flux lines indicate the mean difference between the fluxes from flight versus ground control mice in both tissues. Narrow faded grey lines are fluxes either not significant or not present in the model results. Data displayed is the same flux data shown in the heatmaps in Fig.3 and Fig 6.
Table S6. Cluster and Node annotation for Gene Set Enrichment Analyses (GSEA) of human microarray datasets GLDS-13, GLDS-52, GLDS-114, and GLDS-174 comparing flight to ground treatments, related to Figures 2A, 4A, and 7A.
Table S7. Tab 1 (MuscleCombined_Statistics): Modeled fluxes by sample and statistics for Muscle FLT vs GC, related to Figures 3G and 6D. Tab 2 (LiverCombined_Statistics): Modeled fluxes by sample and statistics for Liver FLT vs GC, related to Figures 3G and 6C.
Highlights.
Multi-omics analysis and techniques with NASA’s GeneLab platform.
The largest cohort of astronaut data to date utilized for analysis.
Mitochondrial dysregulation driving spaceflight health risks.
NASA Twin Study data validates mitochondrial dysfunction during space missions.
Acknowledgments
Funding: Research funding was provided by the GeneLab Project at NASA Ames Research Center, through NASA’s Space Biology Program in the Division of Space Life and Physical Sciences Research and Applications. Any use of trade names is for descriptive purposes only and does not imply endorsement by the US Government. J.S.W. was supported by NASA NNX15AB50G. Metabolomics work by E.C.L was supported by Award Number P30 CA051008 (P.I. Louis Weiner) from the National Cancer Institute. G.H. acknowledges support from NIH U54MD010706, U01DA045300 and QUB startup funds. W.A.d.S. and G.H. acknowledge support from NASA SC Space Grant/EPSCoR. N.S.G. was supported by the American Heart Association (17PRE33670017). The content is solely the responsibility of the authors and does not necessarily represent the official views of the National Institute of Allergy and Infectious Diseases or the National Institutes of Health. The human physiology data reported were supported by the Human Health Countermeasures Element of the NASA Human Research Program, and funding provided to SMS, SRZ, and BEC. We would like to thank the XSEDE Supercomputing Resources, STARR I13-0052, the Vallee and WorldQuant Foundation, The Pershing Square Foundation, NASA (NNX14AH50G, NNX17AB26G, 19-19OMNI_2-0109), the National Institutes of Health (R01MH117406, R01CA249054),TRISH (NNX16AO69A:0107, NNX16AO69A:0061), and the LLS 9238-16, Mak, LLS-MCL7001-18).
Footnotes
Publisher's Disclaimer: This is a PDF file of an unedited manuscript that has been accepted for publication. As a service to our customers we are providing this early version of the manuscript. The manuscript will undergo copyediting, typesetting, and review of the resulting proof before it is published in its final form. Please note that during the production process errors may be discovered which could affect the content, and all legal disclaimers that apply to the journal pertain.
Competing interests: Authors declare no competing interests.
Data and materials availability: All data and code are available in the main text or the supplementary materials.
References
- Akalin A, Kormaksson M, Li S, Garrett-Bakelman FE, Figueroa ME, Melnick A, and Mason CE (2012). methylKit: a comprehensive R package for the analysis of genome-wide DNA methylation profiles. Genome Biol 13, R87. [DOI] [PMC free article] [PubMed] [Google Scholar]
- Alam S, Abdullah CS, Aishwarya R, Morshed M, and Bhuiyan MS (2020). Molecular Perspectives of Mitochondrial Adaptations and Their Role in Cardiac Proteostasis. Front Physiol 11, 1054. [DOI] [PMC free article] [PubMed] [Google Scholar]
- Aranow C (2011). Vitamin D and the immune system. J Investig Med 59, 881–886. [DOI] [PMC free article] [PubMed] [Google Scholar]
- Argiles JM, Campos N, Lopez-Pedrosa JM, Rueda R, and Rodriguez-Manas L (2016). Skeletal Muscle Regulates Metabolism via Interorgan Crosstalk: Roles in Health and Disease. J Am Med Dir Assoc 17, 789–796. [DOI] [PubMed] [Google Scholar]
- Arrieta A, Blackwood EA, Stauffer WT, and Glembotski CC (2020). Integrating ER and Mitochondrial Proteostasis in the Healthy and Diseased Heart. Frontiers in Cardiovascular Medicine 6. [DOI] [PMC free article] [PubMed] [Google Scholar]
- Ashburner M, Ball CA, Blake JA, Botstein D, Butler H, Cherry JM, Davis AP, Dolinski K, Dwight SS, Eppig JT, et al. (2000). Gene ontology: tool for the unification of biology. The Gene Ontology Consortium. Nat Genet 25, 25–29. [DOI] [PMC free article] [PubMed] [Google Scholar]
- Aunon-Chancellor SM, Pattarini JM, Moll S, and Sargsyan A (2020). Venous Thrombosis during Spaceflight. N Engl J Med 382, 89–90. [DOI] [PubMed] [Google Scholar]
- Balakumar P, and Jagadeesh G (2014). A century old renin-angiotensin system still grows with endless possibilities: AT1 receptor signaling cascades in cardiovascular physiopathology. Cell Signal 26, 2147–2160. [DOI] [PubMed] [Google Scholar]
- Balsa E, Soustek MS, Thomas A, Cogliati S, Garcia-Poyatos C, Martin-Garcia E, Jedrychowski M, Gygi SP, Enriquez JA, and Puigserver P (2019a). ER and Nutrient Stress Promote Assembly of Respiratory Chain Supercomplexes through the PERK-eIF2alpha Axis. Mol Cell 74, 877–890 e876. [DOI] [PMC free article] [PubMed] [Google Scholar]
- Balsa E, Soustek MS, Thomas A, Cogliati S, Garcia-Poyatos C, Martin-Garcia E, Jedrychowski M, Gygi SP, Enriquez JA, and Puigserver P (2019b). ER and nutrient stress promote assembly of respiratory chain supercomplexes through the PERK-eIF2alpha axis. Mol Cell 74, 877–890 e876. [DOI] [PMC free article] [PubMed] [Google Scholar]
- Banoth B, and Cassel SL (2018). Mitochondria in innate immune signaling. Transl Res 202, 52–68. [DOI] [PMC free article] [PubMed] [Google Scholar]
- Beheshti A, Cekanaviciute E, Smith DJ, and Costes SV (2018). Global transcriptomic analysis suggests carbon dioxide as an environmental stressor in spaceflight: A systems biology GeneLab case study. Sci Rep 8, 4191. [DOI] [PMC free article] [PubMed] [Google Scholar]
- Beheshti A, Chakravarty K, Fogle H, Fazelinia H, Silveira WAD, Boyko V, Polo SL, Saravia-Butler AM, Hardiman G, Taylor D, et al. (2019). Multi-omics analysis of multiple missions to space reveal a theme of lipid dysregulation in mouse liver. Sci Rep 9, 19195. [DOI] [PMC free article] [PubMed] [Google Scholar]
- Behrouzi R, and Punter M (2018). Diagnosis and management of cerebral venous thrombosis. Clin Med (Lond) 18, 75–79. [DOI] [PMC free article] [PubMed] [Google Scholar]
- Belikov AV, Schraven B, and Simeoni L (2015). T cells and reactive oxygen species. J Biomed Sci 22, 85. [DOI] [PMC free article] [PubMed] [Google Scholar]
- Bezdan D, Grigorev K, Meydan C, Vatter FA, Cioff M, Rao V, Nakahir K, Burnham P, Afshinnekoo E, Westover C, et al. (2020). Dynamics of cell-free DNA and exosomes from before, during, and after long-duration human spaceflight. iScience In press. [Google Scholar]
- Bhansali S, Bhansali A, Walia R, Saikia UN, and Dhawan V (2017). Alterations in Mitochondrial Oxidative Stress and Mitophagy in Subjects with Prediabetes and Type 2 Diabetes Mellitus. Front Endocrinol (Lausanne) 8, 347. [DOI] [PMC free article] [PubMed] [Google Scholar]
- Bhatti JS, Bhatti GK, and Reddy PH (2017). Mitochondrial dysfunction and oxidative stress in metabolic disorders - A step towards mitochondria based therapeutic strategies. Biochim Biophys Acta Mol Basis Dis 1863, 1066–1077. [DOI] [PMC free article] [PubMed] [Google Scholar]
- Bielow C, Mastrobuoni G, and Kempa S (2016). Proteomics Quality Control: Quality Control Software for MaxQuant Results. J Proteome Res 15, 777–787. [DOI] [PubMed] [Google Scholar]
- Bikle DD (2014). Vitamin D metabolism, mechanism of action, and clinical applications. Chem Biol 21, 319–329. [DOI] [PMC free article] [PubMed] [Google Scholar]
- Bindea G, Mlecnik B, Hackl H, Charoentong P, Tosolini M, Kirilovsky A, Fridman WH, Pages F, Trajanoski Z, and Galon J (2009). ClueGO: a Cytoscape plug-in to decipher functionally grouped gene ontology and pathway annotation networks. Bioinformatics 25, 1091–1093. [DOI] [PMC free article] [PubMed] [Google Scholar]
- Brady PS, Ramsay RR, and Brady LJ (1993). Regulation of the long‐chain carnitine acyltransferases. The FASEB journal 7, 1039–1044. [DOI] [PubMed] [Google Scholar]
- Cai C, Song X, Chen Y, Chen X, and Yu C (2020). Relationship between relative skeletal muscle mass and nonalcoholic fatty liver disease: a systematic review and meta-analysis. Hepatol Int 14, 115–126. [DOI] [PMC free article] [PubMed] [Google Scholar]
- Calvo SE, Clauser KR, and Mootha VK (2015). MitoCarta2.0: an updated inventory of mammalian mitochondrial proteins. Nucleic Acids Research 44, D1251–D1257. [DOI] [PMC free article] [PubMed] [Google Scholar]
- Camp KM, Krotoski D, Parisi MA, Gwinn KA, Cohen BH, Cox CS, Enns GM, Falk MJ, Goldstein AC, Gopal-Srivastava R, et al. (2016). Nutritional interventions in primary mitochondrial disorders: Developing an evidence base. Mol Genet Metab 119, 187–206. [DOI] [PMC free article] [PubMed] [Google Scholar]
- Chang ML, and Yang SS (2019). Metabolic Signature of Hepatic Fibrosis: From Individual Pathways to Systems Biology. Cells 8. [DOI] [PMC free article] [PubMed] [Google Scholar]
- Chen K, He L, Li Y, Li X, Qiu C, Pei H, and Yang D (2020). Inhibition of GPR35 Preserves Mitochondrial Function After Myocardial Infarction by Targeting Calpain 1/2. J Cardiovasc Pharmacol 75, 556–563. [DOI] [PMC free article] [PubMed] [Google Scholar]
- Chong J, Soufan O, Li C, Caraus I, Li S, Bourque G, Wishart DS, and Xia J (2018). MetaboAnalyst 4.0: towards more transparent and integrative metabolomics analysis. Nucleic Acids Res 46, W486–W494. [DOI] [PMC free article] [PubMed] [Google Scholar]
- Clément G (2011). Fundamentals of space medicine, Vol 23 (Springer Science & Business Media; ). [Google Scholar]
- Contrepois K, Wu S, Moneghetti KJ, Hornburg D, Ahadi S, Tsai MS, Metwally AA, Wei E, Lee-McMullen B, Quijada JV, et al. (2020). Molecular Choreography of Acute Exercise. Cell 181, 1112–1130 e1116. [DOI] [PMC free article] [PubMed] [Google Scholar]
- Crucian BE, Chouker A, Simpson RJ, Mehta S, Marshall G, Smith SM, Zwart SR, Heer M, Ponomarev S, Whitmire A, et al. (2018). Immune System Dysregulation During Spaceflight: Potential Countermeasures for Deep Space Exploration Missions. Front Immunol 9, 1437. [DOI] [PMC free article] [PubMed] [Google Scholar]
- Crucian BE, Zwart SR, Mehta S, Uchakin P, Quiriarte HD, Pierson D, Sams CF, and Smith SM (2014). Plasma cytokine concentrations indicate that in vivo hormonal regulation of immunity is altered during long-duration spaceflight. J Interferon Cytokine Res 34, 778–786. [DOI] [PMC free article] [PubMed] [Google Scholar]
- Dawson L (2016). The Politics and Perils of Space Exploration: Who Will Compete, Who Will Dominate? (Springer; ). [Google Scholar]
- Day RM, and Suzuki YJ (2006). Cell proliferation, reactive oxygen and cellular glutathione. Dose Response 3, 425–442. [DOI] [PMC free article] [PubMed] [Google Scholar]
- Demontis GC, Germani MM, Caiani EG, Barravecchia I, Passino C, and Angeloni D (2017). Human Pathophysiological Adaptations to the Space Environment. Front Physiol 8, 547. [DOI] [PMC free article] [PubMed] [Google Scholar]
- Diamond DL, Jacobs JM, Paeper B, Proll SC, Gritsenko MA, Carithers RL Jr., Larson AM, Yeh MM, Camp DG 2nd, Smith RD, et al. (2007). Proteomic profiling of human liver biopsies: hepatitis C virus-induced fibrosis and mitochondrial dysfunction. Hepatology 46, 649–657. [DOI] [PubMed] [Google Scholar]
- Dobin A, Davis CA, Schlesinger F, Drenkow J, Zaleski C, Jha S, Batut P, Chaisson M, and Gingeras TR (2013). STAR: ultrafast universal RNA-seq aligner. Bioinformatics 29, 15–21. [DOI] [PMC free article] [PubMed] [Google Scholar]
- Douglas G (2020). Risk of Performance Decrement and Crew Illness Due to Inadequate Food and Nutrition (NASA Human Health Countermeasures; ). [Google Scholar]
- Durante M, and Cucinotta FA (2008). Heavy ion carcinogenesis and human space exploration. Nat Rev Cancer 8, 465–472. [DOI] [PubMed] [Google Scholar]
- Ebrahim A, Lerman JA, Palsson BO, and Hyduke DR (2013). COBRApy: COnstraints-Based Reconstruction and Analysis for Python. BMC Syst Biol 7, 74. [DOI] [PMC free article] [PubMed] [Google Scholar]
- Eichler GS, Huang S, and Ingber DE (2003). Gene Expression Dynamics Inspector (GEDI): for integrative analysis of expression profiles. Bioinformatics 19, 2321–2322. [DOI] [PubMed] [Google Scholar]
- Esteve E, Ricart W, and Fernandez-Real JM (2005). Dyslipidemia and inflammation: an evolutionary conserved mechanism. Clin Nutr 24, 16–31. [DOI] [PubMed] [Google Scholar]
- Fernando R, Drescher C, Nowotny K, Grune T, and Castro JP (2019). Impaired proteostasis during skeletal muscle aging. Free Radic Biol Med 132, 58–66. [DOI] [PubMed] [Google Scholar]
- Finger JH, Smith CM, Hayamizu TF, McCright IJ, Xu J, Law M, Shaw DR, Baldarelli RM, Beal JS, Blodgett O, et al. (2017). The mouse Gene Expression Database (GXD): 2017 update. Nucleic Acids Res 45, D730–D736. [DOI] [PMC free article] [PubMed] [Google Scholar]
- Fluegge D, Moeller LM, Cichy A, Gorin M, Weth A, Veitinger S, Cainarca S, Lohmer S, Corazza S, Neuhaus EM, et al. (2012). Mitochondrial Ca(2+) mobilization is a key element in olfactory signaling. Nat Neurosci 15, 754–762. [DOI] [PubMed] [Google Scholar]
- Forsstrom S, Jackson CB, Carroll CJ, Kuronen M, Pirinen E, Pradhan S, Marmyleva A, Auranen M, Kleine IM, Khan NA, et al. (2019). Fibroblast growth factor 21 drives dynamics of local and systemic stress responses in mitochondrial myopathy with mtDNA deletions. Cell Metabolism 30, 1040–1054 e1047. [DOI] [PubMed] [Google Scholar]
- Garrett-Bakelman FE, Darshi M, Green SJ, Gur RC, Lin L, Macias BR, McKenna MJ, Meydan C, Mishra T, Nasrini J, et al. (2019). The NASA Twins Study: A multidimensional analysis of a year-long human spaceflight. Science 364. [DOI] [PMC free article] [PubMed] [Google Scholar]
- Gertz ML, Chin CR, Tomoiaga D, MacKay M, Butler D, Afshinnekoo E, Bezdan D, Schmidt MA, Mozsary C, Melnick A, et al. (2020). Multi-omic, Single-cell, and Biochemical Profiles of Astronauts Guide Pharmacological Strategies for Returning to Gravity. Cell Reports In Press. [DOI] [PMC free article] [PubMed] [Google Scholar]
- Hamanaka RB, Glasauer A, Hoover P, Yang S, Blatt H, Mullen AR, Getsios S, Gottardi CJ, DeBerardinis RJ, Lavker RM, et al. (2013). Mitochondrial reactive oxygen species promote epidermal differentiation and hair follicle development. Sci Signal 6, ra8. [DOI] [PMC free article] [PubMed] [Google Scholar]
- Ho BS, Vaz C, Ramasamy S, Chew EGY, Mohamed JS, Jaffar H, Hillmer A, Tanavde V, Bigliardi-Qi M, and Bigliardi PL (2019). Progressive expression of PPARGC1alpha is associated with hair miniaturization in androgenetic alopecia. Sci Rep 9, 8771. [DOI] [PMC free article] [PubMed] [Google Scholar]
- Honda Y, Higashibata A, Matsunaga Y, Yonezawa Y, Kawano T, Higashitani A, Kuriyama K, Shimazu T, Tanaka M, Szewczyk NJ, et al. (2012). Genes down-regulated in spaceflight are involved in the control of longevity in Caenorhabditis elegans. Sci Rep 2, 487. [DOI] [PMC free article] [PubMed] [Google Scholar]
- Houtkooper RH, Argmann C, Houten SM, Canto C, Jeninga EH, Andreux PA, Thomas C, Doenlen R, Schoonjans K, and Auwerx J (2011). The metabolic footprint of aging in mice. Sci Rep 1, 134. [DOI] [PMC free article] [PubMed] [Google Scholar]
- Huang da W, Sherman BT, and Lempicki RA (2009). Systematic and integrative analysis of large gene lists using DAVID bioinformatics resources. Nat Protoc 4, 44–57. [DOI] [PubMed] [Google Scholar]
- Hughson RL, Helm A, and Durante M (2018). Heart in space: effect of the extraterrestrial environment on the cardiovascular system. Nat Rev Cardiol 15, 167–180. [DOI] [PubMed] [Google Scholar]
- Ito K, and Suda T (2014). Metabolic requirements for the maintenance of self-renewing stem cells. Nat Rev Mol Cell Biol 15, 243–256. [DOI] [PMC free article] [PubMed] [Google Scholar]
- Jha SK, Jha NK, Kumar D, Ambasta RK, and Kumar P (2017). Linking mitochondrial dysfunction, metabolic syndrome and stress signaling in Neurodegeneration. Biochim Biophys Acta Mol Basis Dis 1863, 1132–1146. [DOI] [PubMed] [Google Scholar]
- Kanehisa M, Goto S, Sato Y, Kawashima M, Furumichi M, and Tanabe M (2014). Data, information, knowledge and principle: back to metabolism in KEGG. Nucleic Acids Res 42, D199–205. [DOI] [PMC free article] [PubMed] [Google Scholar]
- Karnik P, Tekeste Z, McCormick TS, Gilliam AC, Price VH, Cooper KD, and Mirmirani P (2009). Hair follicle stem cell-specific PPARgamma deletion causes scarring alopecia. J Invest Dermatol 129, 1243–1257. [DOI] [PMC free article] [PubMed] [Google Scholar]
- Kelley DE, He J, Menshikova EV, and Ritov VB (2002). Dysfunction of mitochondria in human skeletal muscle in type 2 diabetes. Diabetes 51, 2944–2950. [DOI] [PubMed] [Google Scholar]
- Khan NA, Nikkanen J, Yatsuga S, Jackson C, Wang L, Pradhan S, Kivela R, Pessia A, Velagapudi V, and Suomalainen A (2017a). mTORC1 Regulates Mitochondrial Integrated Stress Response and Mitochondrial Myopathy Progression. Cell Metab 26, 419–428 e415. [DOI] [PubMed] [Google Scholar]
- Khan NA, Nikkanen J, Yatsuga S, Jackson C, Wang L, Pradhan S, Kivela R, Pessia A, Velagapudi V, and Suomalainen A (2017b). mTORC1 regulates mitochondrial integrated stress response and mitochondrial myopathy progression. Cell Metab 26, 419–428 e415. [DOI] [PubMed] [Google Scholar]
- Khazaei M (2012). Chronic Low-grade Inflammation after Exercise: Controversies. Iran J Basic Med Sci 15, 1008–1009. [PMC free article] [PubMed] [Google Scholar]
- Klimchuk D (2007). Structural and functional features of mitochondria in statocytes of soybean root under microgravity conditions. Cytology and Genetics 41, 25–29. [Google Scholar]
- Kluyver T, Ragan-Kelley B, Pérez F, Granger BE, Bussonnier M, Frederic J, Kelley K, Hamrick JB, Grout J, Corlay S, et al. (2016). Jupyter Notebooks - a publishing format for reproducible computational workflows. Paper presented at: ELPUB.
- Kolde R (2015). pheatmap: Pretty heatmaps [Software].
- Koo BK, Kim D, Joo SK, Kim JH, Chang MS, Kim BG, Lee KL, and Kim W (2017). Sarcopenia is an independent risk factor for non-alcoholic steatohepatitis and significant fibrosis. J Hepatol 66, 123–131. [DOI] [PubMed] [Google Scholar]
- Kopinski PK, Janssen KA, Schaefer PM, Trefely S, Perry CE, Potluri P, Tintos-Hernandez JA, Singh LN, Karch KR, Campbell SL, et al. (2019). Regulation of nuclear epigenome by mitochondrial DNA heteroplasmy. Proc Natl Acad Sci U S A 116, 16028–16035. [DOI] [PMC free article] [PubMed] [Google Scholar]
- Kovach CP, Al Koborssy D, Huang Z, Chelette BM, Fadool JM, and Fadool DA (2016). Mitochondrial Ultrastructure and Glucose Signaling Pathways Attributed to the Kv1.3 Ion Channel. Front Physiol 7, 178. [DOI] [PMC free article] [PubMed] [Google Scholar]
- Kunz H, Quiriarte H, Simpson RJ, Ploutz-Snyder R, McMonigal K, Sams C, and Crucian B (2017). Alterations in hematologic indices during long-duration spaceflight. BMC Hematol 17, 12. [DOI] [PMC free article] [PubMed] [Google Scholar]
- Langfelder P, and Horvath S (2008). WGCNA: an R package for weighted correlation network analysis. BMC Bioinformatics 9, 559. [DOI] [PMC free article] [PubMed] [Google Scholar]
- Laphanuwat P, and Jirawatnotai S (2019). Immunomodulatory Roles of Cell Cycle Regulators. Front Cell Dev Biol 7, 23. [DOI] [PMC free article] [PubMed] [Google Scholar]
- Lee SMC, Ribeiro LC, Martin DS, Zwart SR, Feiveson AH, Laurie SS, Macias BR, Crucian BE, Krieger S, Weber D, et al. (2020). Arterial structure and function during and after long-duration spaceflight. J Appl Physiol (1985) 129, 108–123. [DOI] [PubMed] [Google Scholar]
- Leung CCY, and Wong YH (2017). Role of G Protein-Coupled Receptors in the Regulation of Structural Plasticity and Cognitive Function. Molecules 22. [DOI] [PMC free article] [PubMed] [Google Scholar]
- Liberzon A (2014). A description of the Molecular Signatures Database (MSigDB) Web site. Methods Mol Biol 1150, 153–160. [DOI] [PubMed] [Google Scholar]
- Liberzon A, Subramanian A, Pinchback R, Thorvaldsdottir H, Tamayo P, and Mesirov JP (2011). Molecular signatures database (MSigDB) 3.0. Bioinformatics 27, 1739–1740. [DOI] [PMC free article] [PubMed] [Google Scholar]
- Londhe P, and Guttridge DC (2015). Inflammation induced loss of skeletal muscle. Bone 80, 131–142. [DOI] [PMC free article] [PubMed] [Google Scholar]
- Love MI, Huber W, and Anders S (2014). Moderated estimation of fold change and dispersion for RNA-seq data with DESeq2. Genome Biol 15, 550. [DOI] [PMC free article] [PubMed] [Google Scholar]
- Lu B, and Guo S (2020). Mechanisms Linking Mitochondrial Dysfunction and Proteostasis Failure. Trends Cell Biol 30, 317–328. [DOI] [PMC free article] [PubMed] [Google Scholar]
- Lulli M, Cialdai F, Vignali L, Monici M, Luzzi S, Cicconi A, Cacchione S, Magi A, Balsamo M, Vukich M, et al. (2019). The Coenzyme Q10 as an antiapoptotic countermeasure for retinal lesions onboard the International Space Station. In Front Physiol 39th ISGP Meeting & ESA Life Sciences Meeting. [Google Scholar]
- Mak TD, Laiakis EC, Goudarzi M, and Fornace AJ Jr. (2014). MetaboLyzer: a novel statistical workflow for analyzing Postprocessed LC-MS metabolomics data. Anal Chem 86, 506–513. [DOI] [PMC free article] [PubMed] [Google Scholar]
- Massudi H, Grant R, Guillemin GJ, and Braidy N (2012). NAD+ metabolism and oxidative stress: the golden nucleotide on a crown of thorns. Redox Rep 17, 28–46. [DOI] [PMC free article] [PubMed] [Google Scholar]
- Matsuda M, Hayashi H, Garcia-Ojalvo J, Yoshioka-Kobayashi K, Kageyama R, Yamanaka Y, Ikeya M, Toguchida J, Alev C, and Ebisuya M (2020). Species-specific segmentation clock periods are due to differential biochemical reaction speeds. Science 369, 1450–1455. [DOI] [PubMed] [Google Scholar]
- Melchinger H, Jain K, Tyagi T, and Hwa J (2019). Role of Platelet Mitochondria: Life in a Nucleus-Free Zone. Front Cardiovasc Med 6, 153. [DOI] [PMC free article] [PubMed] [Google Scholar]
- Merico D, Isserlin R, Stueker O, Emili A, and Bader GD (2010). Enrichment map: a network-based method for gene-set enrichment visualization and interpretation. PLoS One 5, e13984. [DOI] [PMC free article] [PubMed] [Google Scholar]
- Meyers DE, Basha HI, and Koenig MK (2013). Mitochondrial cardiomyopathy: pathophysiology, diagnosis, and management. Tex Heart Inst J 40, 385–394. [PMC free article] [PubMed] [Google Scholar]
- Mukhopadhyay S, Saha R, Palanisamy A, Ghosh M, Biswas A, Roy S, Pal A, Sarkar K, and Bagh S (2016). A systems biology pipeline identifies new immune and disease related molecular signatures and networks in human cells during microgravity exposure. Sci Rep 6, 25975. [DOI] [PMC free article] [PubMed] [Google Scholar]
- Musso G, Cassader M, Paschetta E, and Gambino R (2018). Bioactive Lipid Species and Metabolic Pathways in Progression and Resolution of Nonalcoholic Steatohepatitis. Gastroenterology 155, 282–302 e288. [DOI] [PubMed] [Google Scholar]
- Nakahata Y, Kaluzova M, Grimaldi B, Sahar S, Hirayama J, Chen D, Guarente LP, and Sassone-Corsi P (2008). The NAD+-dependent deacetylase SIRT1 modulates CLOCK-mediated chromatin remodeling and circadian control. Cell 134, 329–340. [DOI] [PMC free article] [PubMed] [Google Scholar]
- Nelson DL (2013). Lehninger principles of biochemistry, Sixth edition edn (New York: W.H. Freeman and Co.). [Google Scholar]
- Ng YS, Bindoff LA, Gorman GS, Horvath R, Klopstock T, Mancuso M, Martikainen MH, McFarland R, Nesbitt V, Pitceathly RDS, et al. (2019). Consensus-based statements for the management of mitochondrial stroke-like episodes. Wellcome Open Res 4, 201. [DOI] [PMC free article] [PubMed] [Google Scholar]
- Nicogossian AE, Williams RS, Huntoon CL, Doarn CR, Polk JD, and Schneider VS (2016). Space Physiology and Medicine: from evidence to practice (Springer; ). [Google Scholar]
- Nikawa T, Ishidoh K, Hirasaka K, Ishihara I, Ikemoto M, Kano M, Kominami E, Nonaka I, Ogawa T, Adams GR, et al. (2004). Skeletal muscle gene expression in space-flown rats. FASEB J 18, 522–524. [DOI] [PubMed] [Google Scholar]
- Ogoh S, Marais M, Lericollais R, Denise P, Raven PB, and Normand H (2018). Interaction between graviception and carotid baroreflex function in humans during parabolic flight-induced microgravity. J Appl Physiol 125, 634–641. [DOI] [PubMed] [Google Scholar]
- Ohashi N, Isobe S, Ishigaki S, and Yasuda H (2017). Circadian rhythm of blood pressure and the renin-angiotensin system in the kidney. Hypertens Res 40, 413–422. [DOI] [PubMed] [Google Scholar]
- Pavlovski I, Evans JA, and Mistlberger RE (2018). Feeding Time Entrains the Olfactory Bulb Circadian Clock in Anosmic PER2::LUC Mice. Neuroscience 393, 175–184. [DOI] [PubMed] [Google Scholar]
- Pecaut MJ, Mao XW, Bellinger DL, Jonscher KR, Stodieck LS, Ferguson VL, Bateman TA, Mohney RP, and Gridley DS (2017). Is spaceflight-induced immune dysfunction linked to systemic changes in metabolism? PLoS One 12, e0174174. [DOI] [PMC free article] [PubMed] [Google Scholar]
- Pedersen BS, Eyring K, De S, Yang IV, and Schwartz DA (2014). Fast and accurate alignment of long bisulfite-seq reads. arXiv:14011129.
- Plubell DL, Wilmarth PA, Zhao Y, Fenton AM, Minnier J, Reddy AP, Klimek J, Yang X, David LL, and Pamir N (2017). Extended Multiplexing of Tandem Mass Tags (TMT) Labeling Reveals Age and High Fat Diet Specific Proteome Changes in Mouse Epididymal Adipose Tissue. Mol Cell Proteomics 16, 873–890. [DOI] [PMC free article] [PubMed] [Google Scholar]
- Pottecher J, Adamopoulos C, Lejay A, Bouitbir J, Charles AL, Meyer A, Singer M, Wolff V, Diemunsch P, Laverny G, et al. (2018). Diabetes Worsens Skeletal Muscle Mitochondrial Function, Oxidative Stress, and Apoptosis After Lower-Limb Ischemia-Reperfusion: Implication of the RISK and SAFE Pathways? Front Physiol 9, 579. [DOI] [PMC free article] [PubMed] [Google Scholar]
- Pratesi A, Tarantini F, and Di Bari M (2013). Skeletal muscle: an endocrine organ. Clin Cases Miner Bone Metab 10, 11–14. [DOI] [PMC free article] [PubMed] [Google Scholar]
- Quiros PM, Prado MA, Zamboni N, D’Amico D, Williams RW, Finley D, Gygi SP, and Auwerx J (2017). Multi-omics analysis identifies ATF4 as a key regulator of the mitochondrial stress response in mammals. J Cell Biol 216, 2027–2045. [DOI] [PMC free article] [PubMed] [Google Scholar]
- Ramezani RJ, and Stacpoole PW (2014). Sleep disorders associated with primary mitochondrial diseases. J Clin Sleep Med 10, 1233–1239. [DOI] [PMC free article] [PubMed] [Google Scholar]
- Ray S, Gebre S, Fogle H, Berrios DC, Tran PB, Galazka JM, and Costes SV (2019). GeneLab: Omics database for spaceflight experiments. Bioinformatics 35, 1753–1759. [DOI] [PubMed] [Google Scholar]
- Rinninella E, Pizzoferrato M, Cintoni M, Servidei S, and Mele MC (2018). Nutritional support in mitochondrial diseases: the state of the art. Eur Rev Med Pharmacol Sci 22, 4288–4298. [DOI] [PubMed] [Google Scholar]
- Ritchie ME, Phipson B, Wu D, Hu Y, Law CW, Shi W, and Smyth GK (2015). limma powers differential expression analyses for RNA-sequencing and microarray studies. Nucleic Acids Res 43, e47. [DOI] [PMC free article] [PubMed] [Google Scholar]
- Sardon Puig L, Valera-Alberni M, Canto C, and Pillon NJ (2018). Circadian Rhythms and Mitochondria: Connecting the Dots. Front Genet 9, 452. [DOI] [PMC free article] [PubMed] [Google Scholar]
- Schultz A, and Qutub AA (2016). Reconstruction of Tissue-Specific Metabolic Networks Using CORDA. PLoS Comput Biol 12, e1004808. [DOI] [PMC free article] [PubMed] [Google Scholar]
- Sergushichev AA (2016). An algorithm for fast preranked gene set enrichment analysis using cumulative statistic calculation. bioRxiv, 060012. [Google Scholar]
- Shannon P, Markiel A, Ozier O, Baliga NS, Wang JT, Ramage D, Amin N, Schwikowski B, and Ideker T (2003). Cytoscape: a software environment for integrated models of biomolecular interaction networks. Genome Res 13, 2498–2504. [DOI] [PMC free article] [PubMed] [Google Scholar]
- Shimura T, Kobayashi J, Komatsu K, and Kunugita N (2016). Severe mitochondrial damage associated with low-dose radiation sensitivity in ATM- and NBS1-deficient cells. Cell Cycle 15, 1099–1107. [DOI] [PMC free article] [PubMed] [Google Scholar]
- Siasos G, Tsigkou V, Kosmopoulos M, Theodosiadis D, Simantiris S, Tagkou NM, Tsimpiktsioglou A, Stampouloglou PK, Oikonomou E, Mourouzis K, et al. (2018). Mitochondria and cardiovascular diseases-from pathophysiology to treatment. Ann Transl Med 6, 256. [DOI] [PMC free article] [PubMed] [Google Scholar]
- Sigurdsson MI, Jamshidi N, Steingrimsson E, Thiele I, and Palsson BO (2010). A detailed genome-wide reconstruction of mouse metabolism based on human Recon 1. BMC Syst Biol 4, 140. [DOI] [PMC free article] [PubMed] [Google Scholar]
- Smith CL, Blake JA, Kadin JA, Richardson JE, Bult CJ, and Mouse Genome Database G (2018). Mouse Genome Database (MGD)-2018: knowledgebase for the laboratory mouse. Nucleic Acids Res 46, D836–D842. [DOI] [PMC free article] [PubMed] [Google Scholar]
- Smith RW, Scott PJ, and Szpunar B (2009). Solute diffusion in nonionic liquids--effects of gravity. Ann N Y Acad Sci 1161, 526–536. [DOI] [PubMed] [Google Scholar]
- Smith SM, Heer M, Shackelford LC, Sibonga JD, Spatz J, Pietrzyk RA, Hudson EK, and Zwart SR (2015). Bone metabolism and renal stone risk during International Space Station missions. Bone 81, 712–720. [DOI] [PubMed] [Google Scholar]
- Smith SM, Heer M, Wang Z, Huntoon CL, and Zwart SR (2012a). Long-duration space flight and bed rest effects on testosterone and other steroids. J Clin Endocrinol Metab 97, 270–278. [DOI] [PMC free article] [PubMed] [Google Scholar]
- Smith SM, Heer MA, Shackelford LC, Sibonga JD, Ploutz-Snyder L, and Zwart SR (2012b). Benefits for bone from resistance exercise and nutrition in long-duration spaceflight: Evidence from biochemistry and densitometry. J Bone Miner Res 27, 1896–1906. [DOI] [PubMed] [Google Scholar]
- Smith SM, Zwart SR, Block G, Rice BL, and Davis-Street JE (2005). The nutritional status of astronauts is altered after long-term space flight aboard the International Space Station. J Nutr 135, 437–443. [DOI] [PubMed] [Google Scholar]
- Sorriento D, Gambardella J, Fiordelisi A, Iaccarino G, and Illario M (2019). GRKs and beta-Arrestins: “Gatekeepers” of Mitochondrial Function in the Failing Heart. Front Pharmacol 10, 64. [DOI] [PMC free article] [PubMed] [Google Scholar]
- Spiegelman BM, and Heinrich R (2004). Biological control through regulated transcriptional coactivators. Cell 119, 157–167. [DOI] [PubMed] [Google Scholar]
- Stein R, Ferrari F, and Scolari F (2019). Genetics, Dyslipidemia, and Cardiovascular Disease: New Insights. Curr Cardiol Rep 21, 68. [DOI] [PubMed] [Google Scholar]
- Strollo F, Gentile S, Strollo G, Mambro A, and Vernikos J (2018). Recent Progress in Space Physiology and Aging. Front Physiol 9, 1551. [DOI] [PMC free article] [PubMed] [Google Scholar]
- Subramanian A, Tamayo P, Mootha VK, Mukherjee S, Ebert BL, Gillette MA, Paulovich A, Pomeroy SL, Golub TR, Lander ES, et al. (2005). Gene set enrichment analysis: a knowledge-based approach for interpreting genome-wide expression profiles. Proc Natl Acad Sci U S A 102, 15545–15550. [DOI] [PMC free article] [PubMed] [Google Scholar]
- Suomalainen A, and Battersby BJ (2018). Mitochondrial diseases: the contribution of organelle stress responses to pathology. Nat Rev Mol Cell Biol 19, 77–92. [DOI] [PubMed] [Google Scholar]
- Thomer AK, Twidale MB, Guo J, and Yoder MJ (2016). Picard Tools. Paper presented at: Conf Hum Factors Comput Syst - Proc. [Google Scholar]
- Topf U, Uszczynska-Ratajczak B, and Chacinska A (2019). Mitochondrial stress-dependent regulation of cellular protein synthesis. J Cell Sci 132. [DOI] [PubMed] [Google Scholar]
- Tyanova S, Temu T, and Cox J (2016a). The MaxQuant computational platform for mass spectrometry-based shotgun proteomics. Nat Protoc 11, 2301–2319. [DOI] [PubMed] [Google Scholar]
- Tyanova S, Temu T, Sinitcyn P, Carlson A, Hein MY, Geiger T, Mann M, and Cox J (2016b). The Perseus computational platform for comprehensive analysis of (prote)omics data. Nat Methods 13, 731–740. [DOI] [PubMed] [Google Scholar]
- Upton JH, Hannen RF, Bahta AW, Farjo N, Farjo B, and Philpott MP (2015). Oxidative stress-associated senescence in dermal papilla cells of men with androgenetic alopecia. J Invest Dermatol 135, 1244–1252. [DOI] [PubMed] [Google Scholar]
- Wallace DC (2013). A mitochondrial bioenergetic etiology of disease. J Clin Invest 123, 1405–1412. [DOI] [PMC free article] [PubMed] [Google Scholar]
- Wang F, Zhang S, Jeon R, Vuckovic I, Jiang X, Lerman A, Folmes CD, Dzeja PD, and Herrmann J (2018). Interferon Gamma Induces Reversible Metabolic Reprogramming of M1 Macrophages to Sustain Cell Viability and Pro-Inflammatory Activity. EBioMedicine 30, 303–316. [DOI] [PMC free article] [PubMed] [Google Scholar]
- Wang HQ, Tuominen LK, and Tsai CJ (2011). SLIM: a sliding linear model for estimating the proportion of true null hypotheses in datasets with dependence structures. Bioinformatics 27, 225–231. [DOI] [PubMed] [Google Scholar]
- West AP, and Shadel GS (2017). Mitochondrial DNA in innate immune responses and inflammatory pathology. Nat Rev Immunol 17, 363–375. [DOI] [PMC free article] [PubMed] [Google Scholar]
- Williams R, Laskovs M, Williams RI, Mahadevan A, and Labbadia J (2020). A Mitochondrial Stress-Specific Form of HSF1 Protects against Age-Related Proteostasis Collapse. Dev Cell. [DOI] [PubMed] [Google Scholar]
- Wong YL, LeBon L, Basso AM, Kohlhaas KL, Nikkel AL, Robb HM, Donnelly-Roberts DL, Prakash J, Swensen AM, Rubinstein ND, et al. (2019). eIF2B activator prevents neurological defects caused by a chronic integrated stress response. eLife 8, e42940. [DOI] [PMC free article] [PubMed] [Google Scholar]
- Wu B, Wang Y, Wu X, Liu D, Xu D, and Wang F (2018). On-orbit sleep problems of astronauts and countermeasures. Mil Med Res 5, 17. [DOI] [PMC free article] [PubMed] [Google Scholar]
- Wu LL, Chiou CC, Chang PY, and Wu JT (2004). Urinary 8-OHdG: a marker of oxidative stress to DNA and a risk factor for cancer, atherosclerosis and diabetics. Clin Chim Acta 339, 1–9. [DOI] [PubMed] [Google Scholar]
- Yan Z, and Banerjee R (2010). Redox remodeling as an immunoregulatory strategy. Biochemistry 49, 1059–1066. [DOI] [PMC free article] [PubMed] [Google Scholar]
- Yang Y, Waters JB, Fruh K, and Peterson PA (1992). Proteasomes are regulated by interferon gamma: implications for antigen processing. Proc Natl Acad Sci U S A 89, 4928–4932. [DOI] [PMC free article] [PubMed] [Google Scholar]
- Ye X, and Carew TJ (2010). Small G protein signaling in neuronal plasticity and memory formation: the specific role of ras family proteins. Neuron 68, 340–361. [DOI] [PMC free article] [PubMed] [Google Scholar]
- Yin H, Gao L, Tai HH, Murphey LJ, Porter NA, and Morrow JD (2007). Urinary prostaglandin F2alpha is generated from the isoprostane pathway and not the cyclooxygenase in humans. J Biol Chem 282, 329–336. [DOI] [PubMed] [Google Scholar]
- Zhang Q, Raoof M, Chen Y, Sumi Y, Sursal T, Junger W, Brohi K, Itagaki K, and Hauser CJ (2010). Circulating mitochondrial DAMPs cause inflammatory responses to injury. Nature 464, 104–107. [DOI] [PMC free article] [PubMed] [Google Scholar]
- Zhang SY, Yang KL, Zeng LT, Wu XH, and Huang HY (2018). Effectiveness of Coenzyme Q10 Supplementation for Type 2 Diabetes Mellitus: A Systematic Review and Meta-Analysis. Int J Endocrinol 2018, 6484839. [DOI] [PMC free article] [PubMed] [Google Scholar]
- Zhong Z, Liang S, Sanchez-Lopez E, He F, Shalapour S, Lin XJ, Wong J, Ding S, Seki E, Schnabl B, et al. (2018). New mitochondrial DNA synthesis enables NLRP3 inflammasome activation. Nature 560, 198–203. [DOI] [PMC free article] [PubMed] [Google Scholar]
- Zwart SR, Booth SL, Peterson JW, Wang Z, and Smith SM (2011). Vitamin K status in spaceflight and ground-based models of spaceflight. J Bone Miner Res 26, 948–954. [DOI] [PMC free article] [PubMed] [Google Scholar]
- Zwart SR, Gregory JF, Zeisel SH, Gibson CR, Mader TH, Kinchen JM, Ueland PM, Ploutz-Snyder R, Heer MA, and Smith SM (2016). Genotype, B-vitamin status, and androgens affect spaceflight-induced ophthalmic changes. FASEB J 30, 141–148. [DOI] [PMC free article] [PubMed] [Google Scholar]
- Zwart SR, Morgan JL, and Smith SM (2013). Iron status and its relations with oxidative damage and bone loss during long-duration space flight on the International Space Station. Am J Clin Nutr 98, 217–223. [DOI] [PubMed] [Google Scholar]
- Zwart SR, Oliver SA, Fesperman JV, Kala G, Krauhs J, Ericson K, and Smith SM (2009). Nutritional status assessment before, during, and after long-duration head-down bed rest. Aviat Space Environ Med 80, A15–22. [DOI] [PubMed] [Google Scholar]
Associated Data
This section collects any data citations, data availability statements, or supplementary materials included in this article.
Supplementary Materials
Figure S1. Multi-omics and cross-tissue pathway analysis on data from mice flown in space, related to Figures 2B, 4B, 6A, and 7B. Complete set of pathway results were integrated across multiple tissues and RNAseq and proteomics platforms to summarize the system-wide effects of spaceflight compared to ground control. Enriched GO terms and KEGG pathways were integrating using a network framework, where two pathways are connected by an edge if they share a significant fraction of genes. Pathways dysregulated in two or more tissues are displayed. Pathway up and down regulation is encoded by node color, and pathways dysregulated by multiple tissues are mapped to larger node size.
Figure S2. Spaceflight mice muscle metabolomics, related to Figure 3A. A) GEDI self-organizing maps showing global metabolomic shifts due to the effects of spaceflight. B) Carnitine and malate levels with their theoretical fragmentation spectra from Progenesis QI. Levels are depicted as mean ± standard error of the mean. * p<0.05, ** p<0.01.
Figure S3. Multi-omics and cross-tissue pathway analysis on data from mice flown in space, related to Figures 2C, 4C, and 7C. Complete set of pathway results were integrated across multiple muscles and RNAseq and proteomics platforms to summarize the system-wide effects of spaceflight compared to ground control. Enriched GO terms and KEGG pathways were integrating using a network framework, where two pathways are connected by an edge if they share a significant fraction of genes. Pathways dysregulated in two or more tissues are displayed. Pathway up and down regulation is encoded by node color, and pathways dysregulated by multiple tissues are mapped to larger node size. Muscle name legend: Carotid Artery (Carotid), Gastrocnemius Muscle (GST), Quadriceps Muscle (Quad), Soleus Muscle (SLS), Tibialis Anterior Muscle (TA), Extensor Digitorum Longus Muscle (EDL).
Figure S4. MS/MS spectra of A) Carnitine, B) L-Arginine, and C) Tetradecanoylcarnitine (myristoylcarnitine) by comparing fragmentation patterns of QC’s with fragmentation patterns of pure chemicals, related to Figure 3A.
Figure S5. MS/MS spectra of A) Glucose, B) Malic acid (malate), C) fructose-6-phosphate, and D. citric acid by comparing fragmentation patterns of QC’s with fragmentation patterns of pure chemicals, related to Figure 3A. Fragments for glucose were matched to those in the database HMDB.
Figure S6. MS/MS spectra of pantothenic acid with zoomed in regions, related to Figure 3A. All fragmentation patterns in the QC were compared to fragmentation patterns of a pure chemical.
Figure S7. Significant changes in flux pathways displayed on carbohydrate-related metabolic pathways in muscle using an adapted version of the visualization Escher package, related to Figures 3G and 6D. Colors on the thicker width flux lines indicate the mean difference between the fluxes from flight versus ground control mice in both tissues. Narrow faded grey lines are fluxes either not significant or not present in the model results. Data displayed is the same flux data shown in the heatmaps in Fig.3 and Fig 6.
Figure S8. Significant changes in flux pathways displayed on carbohydrate-related metabolic pathways in liver using an adapted version of the visualization Escher package, related to Figures 3G and 6C. Colors on the thicker width flux lines indicate the mean difference between the fluxes from flight versus ground control mice in both tissues. Narrow faded grey lines are fluxes either not significant or not present in the model results. Data displayed is the same flux data shown in the heatmaps in Fig.3 and Fig 6.
Table S6. Cluster and Node annotation for Gene Set Enrichment Analyses (GSEA) of human microarray datasets GLDS-13, GLDS-52, GLDS-114, and GLDS-174 comparing flight to ground treatments, related to Figures 2A, 4A, and 7A.
Table S7. Tab 1 (MuscleCombined_Statistics): Modeled fluxes by sample and statistics for Muscle FLT vs GC, related to Figures 3G and 6D. Tab 2 (LiverCombined_Statistics): Modeled fluxes by sample and statistics for Liver FLT vs GC, related to Figures 3G and 6C.
Data Availability Statement
The published article includes the WGCNA code generated and analyzed during this study in Methods S1. All other code referred in the Key Resources Table are standard code available through the link and references. The original/source data for all GeneLab datasets (GLDS) in the paper is available on GeneLab (https://genelab.nasa.gov/) with the specific GLDS identifier numbers in the Key Resource Table. The metabolomic data generated for this paper is available on NASA’s GeneLab platform with identifier: GLDS-343 and DOI: 10.26030/h968-2m75.
KEY RESOURCE TABLE
| REAGENT or RESOURCE | SOURCE | IDENTIFIER |
|---|---|---|
| Code | ||
| WGCNA code (Method S1) | This paper | N/A |
| Biological Samples | ||
| Human Blood | NASA Twin Study | http://www.nasa.gov/twins-study/ |
| Human T Cells | ISS Expedition 14 | https://www.nasa.gov/mission_pages/station/expeditions/expedition14/ |
| Human Hair Follicles | ISS Expeditions from July 2009 to February 2013 | https://www.nasa.gov/mission_pages/station/expeditions/past.html |
| Mouse adrenal gland | NASA Rodent Research-1 Mission | https://lsdajsc.nasa.gov/Experiment/exper/13380 |
| Mouse extensor digitorum longus muscle | NASA Rodent Research-1 Mission | https://lsda.lsc.nasa.gov/Experiment/exper/13380 |
| Mouse eye | NASA Rodent Research-1 Mission | https://lsda.isc.nasa.gov/Experiment/exper/13380 |
| Mouse gastrocnemius muscle | NASA Rodent Research-1 Mission | https://lsda.jsc.nasa.gov/Experiment/exper/13380 |
| Mouse kidney | NASA Rodent Research-1 Mission | https://lsda.jsc.nasa.gov/Experiment/exper/13380 |
| Mouse Liver | NASA Rodent Research-1 Mission | https://lsda.jsc.nasa.gov/Experiment/exper/13380 |
| Mouse quadriceps muscle | NASA Rodent Research-1 Mission | https://lsda.isc.nasa.gov/Experiment/exper/13380 |
| Mouse soleus muscle | NASA Rodent Research-1 Mission | https://lsda.jsc.nasa.gov/Experiment/exper/13380 |
| Mouse tibialis anterior muscle | NASA Rodent Research-1 Mission | https://lsdaisc.nasa.gov/Experiment/exper/13380 |
| Mouse adrenal gland | NASA Rodent Research-3 Mission | https://lsdajsc.nasa.gov/Experiment/exper/13961 |
| Mouse eye | NASA Rodent Research-3 Mission | https://lsda.jsc.nasa.gov/Experiment/exper/13961 |
| Mouse kidney | NASA Rodent Research-3 Mission | https://lsda.jsc.nasa.gov/Experiment/exper/13961 |
| Mouse Liver | NASA Rodent Research-3 Mission | https://lsdaisc.nasa.gov/Experiment/exper/13961 |
| Mouse gastrocnemius muscle | NASA Rodent Research-9 Mission | https://lsdajsc.nasa.gov/Experiment/exper/13964 |
| Mouse quadriceps muscle | NASA Rodent Research-9 Mission | https://lsdajsc.nasa.gov/Experiment/exper/13964 |
| Chemicals. Peptides, and Recombinant Proteins | ||
| D-Pantothenic acid acid hemicalcium salt | Sigma Aldrich | P2250 |
| D-Malic acid | Sigma Aldrich | 46940-U |
| a-D-Glucose | Sigma Aldrich | 158968-25G |
| D-Fructose-6-phosphate disodium salt hydrate | Sigma Aldrich | F3627 |
| Citric Acid | Sigma Aldrich | C1857 |
| L-Carnitine hydrochloride | Sigma Aldrich | C0283 |
| L-Arginine | Sigma Aldrich | A5006 |
| Tetradecanoylcamitine (myristoyl-L-carnitine) | Sigma Aldrich | 91582 |
| 4-Nitrobenzoic acid | Sigma Aldrich | 72910 |
| Debrisoquine sulfate | Sigma Aldrich | D1306 |
| Chlorpropamide | Sigma Aldrich | C1290 |
| Acetaminophen | Sigma Aldrich | 103-90-2 |
| Sulfaguanidine | Sigma Aldrich | 57-67-0 |
| Sulfadimethoxine | Sigma Aldrich | 122-11-2 |
| Val-Tyr-Val | Sigma Aldrich | 17355-22-5 |
| Terfenadine | Sigma Aldrich | 50679-08-8 |
| Leu-Enk acetate salt hydrate | Sigma Aldrich | 58822-25-6 |
| Critical Commercial Assays | ||
| micro BCA protein assay | Thermo Scientifc | 23235 |
| Deposited Data | ||
| GLDS-98 | NASA/GeneLab | https://genelab-data.ndc.nasa.gov/genelab/accession/GLDS-98/ |
| GLDS-99 | NASA/GeneLab | https://genelab-data.ndc.nasa.gov/genelab/accession/GLDS-99/ |
| GLDS-100 | NASA/GeneLab | https://genelab-data.ndc.nasa.gov/genelab/accession/GLDS-100/ |
| GLDS-101 | NASA/GeneLab | https://genelab-data.ndc.nasa.gov/genelab/accession/GLDS-101/ |
| GLDS-102 | NASA/GeneLab | https://genelab-data.ndc.nasa.gov/genelab/accession/GLDS-102/ |
| GLDS-103 | NASA/GeneLab | https://genelab-data.ndc.nasa.gov/genelab/accession/GLDS-103/ |
| GLDS-104 | NASA/GeneLab | https://genelab-data.ndc.nasa.gov/genelab/accession/GLDS-104/ |
| GLDS-105 | NASA/GeneLab | https://genelab-data.ndc.nasa.gov/genelab/accession/GLDS-105/ |
| GLDS-161 | NASA/GeneLab | https://genelab-data.ndc.nasa.gov/genelab/accession/GLDS-161/ |
| GLDS-162 | NASA/GeneLab | https://genelab-data.ndc.nasa.gov/genelab/accession/GLDS-162/ |
| GLDS-163 | NASA/GeneLab | https://genelab-data.ndc.nasa.gov/genelab/accession/GLDS-163/ |
| GLDS-168 | NASA/GeneLab | https://genelab-data.ndc.nasa.gov/genelab/accession/GLDS-168/ |
| GLDS-13 | NASA/GeneLab | https://genelab-data.ndc.nasa.gov/genelab/accession/GLDS-13/ |
| GLDS-52 | NASA/GeneLab | https://genelab-data.ndc.nasa.gov/genelab/accession/GLDS-52/ |
| GLDS-54 | NASA/GeneLab | https://genelab-data.ndc.nasa.gov/genelab/accession/GLDS-54/ |
| GLDS-114 | NASA/GeneLab | https://genelab-data.ndc.nasa.gov/genelab/accession/GLDS-114/ |
| GLDS-118 | NASA/GeneLab | https://genelab-data.ndc.nasa.gov/genelab/accession/GLDS-118/ |
| GLDS-174 | NASA/GeneLab | https://genelab-data.ndc.nasa.gov/genelab/accession/GLDS-174/ |
| GLDS-47 | NASA/GeneLab | https://genelab-data.ndc.nasa.gov/genelab/accession/GLDS-47/ |
| GLDS-48 | NASA/GeneLab | https://genelab-data.ndc.nasa.gov/genelab/accession/GLDS-48/ |
| GLDS-343 | NASA/GeneLab | https://doi.org/10.26030/h968-2m75 |
| Experimental Models: Cell Lines | ||
| Fibroblasts AG01522 | Coriell Institute | https://www.coriell.org/0/Sections/Search/Sample_Detail.aspx?Ref=AG01522, RRID: CVCL_H759 |
| HUVEC | ATCC | HUV-EC-C [HUVEC] (ATCC CRL-1730), RRID: CVCL_2959 |
| HMVEC-dBL | LONZA | Catalog Number: CC-2543 |
| Experimental Models: Organisms/Strains | ||
| Mouse: C57BL/6 | Jackson Labs | C57BL/6J (Stock No: 000664) |
| Mouse: BALB/c | Jackson Labs | BALB/c (Stock No: 000651) |
| Oligonucleotides | ||
| Primer. MT-RNR1: Forward - ATGCAGCTCAAAACGCTTAGC | This paper | N/A |
| Primer MT-RNR1: Reverse - GCTGGCACGAAATTGACCAA | This paper | N/A |
| Primer MT-RNR2: Forward - CCCTGTACGAAAGGACAAGAGAAAT | This paper | N/A |
| Primer MT-RNR2: Reverse - TCTTGGGTGGGTGTGGGTATAAT | This paper | N/A |
| Primer: MT-COI: Forward - CAGCAGTCCTACTTCTCCTATCTCT | This paper | N/A |
| Primer MT-C01: Reverse - GGGTCGAAGAAGGTGGTGTT | This paper | N/A |
| Primer MT-C02: Forward - GCCCTTTTCCTAACACTCACAACAA | This paper | N/A |
| Primer MT-C02: Reverse - GTAAAGGATGCGTAGGGATGGG | This paper | N/A |
| Primer MT-ND1: Forward - CCCTAAAACCCGCCACATCT | This paper | N/A |
| Primer MT-ND1: Reverse - GGCTAGAATAAATAGGAGGCCTAGGT | This paper | N/A |
| Primer: 18S rRNA: Forward - GGCCCTGTAATTGGAATGAGTC | This paper | N/A |
| Primer: 18S rRNA Reverse - CCAAGATCCAACTACGAGCTT | This paper | N/A |
| Primer GAPDH: Forward - AAGGTGAAGGTCGGAGTCAAC | This paper | N/A |
| Primer GAPDH: Reverse - GGGGTCATTGATGGCAACAATA | This paper | N/A |
| Software and Algorithms | ||
| FASTQC version 0.11.8 | N/A | https://www.bioinformatics.babraham.ac.uk/projects/fastqc/, RRID: SCR_014583 |
| Trim Galore! Version 0.50 | N/A | https://www.bioinformatics.babraham.ac.uk/projects/trim_galore/, RRID: SCR_011847 |
| STAR version STAR_2.6.1a_08-27 | Dobin et al., 2013 | https://github.com/alexdobin/STAR, RRID: SCR_015899 |
| mice genome version mm 10-GRCm38 | N/A | https://www.ncbi.nlm.nih.gov/assembly/GCF_000001635.20/ |
| RSEM version 1.3.1 | Dobin et al., 2013 | https://deweylab.github.io/RSEM/, RRID: SCR_013027 |
| R Version 3.5.1 and 4.0.2 | R Core Team (2020). | https://www.r-project.org/, RRID: SCR_001905 |
| DESeq2 Version 1.22.2 | Love et al., 2014 | https://github.com/mlkelove/DESeq2, RRID: SCR_01568 |
| Picard MarkDuplicates v2.10.10-SNAPSHOT | N/A | https://broadinstitute.grthub.io/picard/, RRID: SCR_00652 |
| MethylDackel mbias | N/A | https://github.com/dpryan79/MethylDackel |
| methylKit | Akalin et al., 2012 | https://www.bioconductor.org/packages/release/bioc/html/methylKit.html, RRID: SCR_005177 |
| LIMMA | Ritchie et al., 2015 | https://www.bioconductor.org/packages/release/bioc/html/limma.html, RRID: SCR_010943 |
| GSEA | Sergushichev, 2016; Subramanian et al., 2005 | https://www.gsea-msigdb.arg/gsea/lindex.jsp, RRID: SCR_003199 |
| MaxQuant (1.6.2.3) | Tyanova et al., 2016a | https://www.maxquarst.org/, RRID: SCR_014485 |
| Uniprot (downloaded on 20180104) | Tyanova et al., 2016a | https://www.unipfot.org/, RRID: SCR_002380 |
| PTXQC | Bielow et al., 2016 | https://github.com/cbielow/PTXQC |
| Perseus (1.6.2.2) | Tyanova et al., 2016b | https://maxquant.net/perseus/, RRID: SCR_015753 |
| NCI DAVID | Huang et al., 2009 | https://david.ncifcrf.gov/, RRID: SCR_00188 |
| EnhancedVolcano package (Bioconductor) | Ritchie et al., 2015 | http://bioconductor.org/packages/release/bioc/html/EnhancedVolcano.html, RRID: SCR_018931 |
| Cytoscape | Shannon et al., 2003 | https://cytoscape.org, RRID: SCR_003032 |
| ClueGo | Bindea et al., 2009 | http://apps.cytoscape.org/apps/cluego, RRID: SCR_005748 |
| EnrichmentMap | Merico et al., 2010 | http://apps.cytoscape.org/apps/enrichmentmap, RRID: SCR_016052 |
| Progenesis QI | N/A | http://www.nonlinear.com/progenesis/qi/, RRID: SCR_018923 |
| MetaboLyzer | Mak et al., 2014 | https://sites.google.com/a/georgetown.edu/fornace-lab-informatics/home/metabotyzer |
| Gene Expression Dynamics Inspector (GEDI) | Eichler et al., 2003 | RRID: SCR_008530 |
| MetaboAnalyst | Chong et al., 2018 | https://www.metaboanatyst.ca/, RRID: SCR_015539 |
| Python version 3.7.6 and version 3.8.3 | Van Rossum and Drake, 1995 |
https://www.python.org/downloads/release/python-376/ https://www.python.org/downloads/release/python-383/, RRID: SCR_008394 |
| COBRApy version 0.19.0 (using Python 3.8.3) | Ebrahim et al., 2013 | https://pypi.org/project/cobra/, RRID: SCR_01209 |
| Corda version 0.4.2 (for COBRApy) | Schultz and Qutub, 2016 | https://github.com/qutubiab/CORDA |
| imm1415 metabolic model from BiGG (for COBRApy) | Sigurdsson et al., 2010 | https://www.ebi.ac.uk/biomodels/MODEL1507180055 |
| Gurobi Optimizer version 8.1.0 LP (for COBRApy) | Gurobi Optimization. L. L. C. (2020). | https://www.gurobi.com/ |
| Numpy python package v 1.18.1 (with Python 3.7.6) | Harris et al., 2020 | https://njmpy.org/, RRID: SCR_008633 |
| Escher version 1.7.3 (with Python 3.7.6) | King et al., 2015 | http://escher.github.io/#/ |
| pandas 1.0.1 (with Python 3.7.6) | N/A | https://pancas.pydata.org/, RRID: SCR_018214 |
| ipython version 7.12.0 (with Python 3.7.6) | Perez and Granger, 2007 | https://ipython.org/, RRID: SCR_001658 |
| Jupyter Notebook 6.0.3 (with Python 3.7.6) | Kluyver et al., (2016). | https://jupyter.org/, RRID: SCR_018315 |
| pheatmap R package version 1.0.12 | Kolde (2015). | https://github.com/raivokolde/pheatmap, RRID: SCR_016418 |
| bwa-meth version 0.2.2 | Pedersen et al., 2014 | https://github.com/brentp/bwa-meth |
| Kallisto | Bray et al., 2016 | https://pachterlab.github.io/kallito/, RRID: SCR_016582 |
| Other | ||
| GeneLab | NASA | https://genelab.nasa.gov/ |