Figure 1.

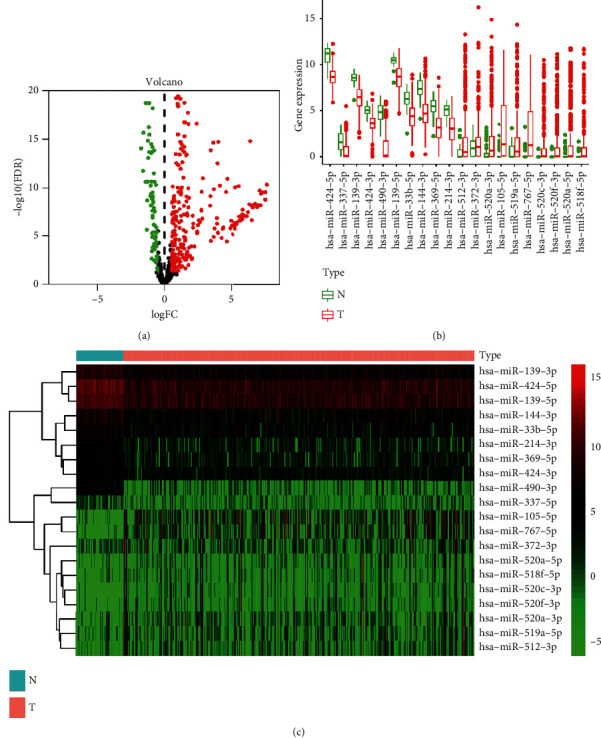
Differentially expressed MRMs between HCC and normal tissue. (a) Volcano plots showing miRNAs expression. (b) and (c) Top 10 upregulated and top 10 downregulated miRNAs.

Differentially expressed MRMs between HCC and normal tissue. (a) Volcano plots showing miRNAs expression. (b) and (c) Top 10 upregulated and top 10 downregulated miRNAs.