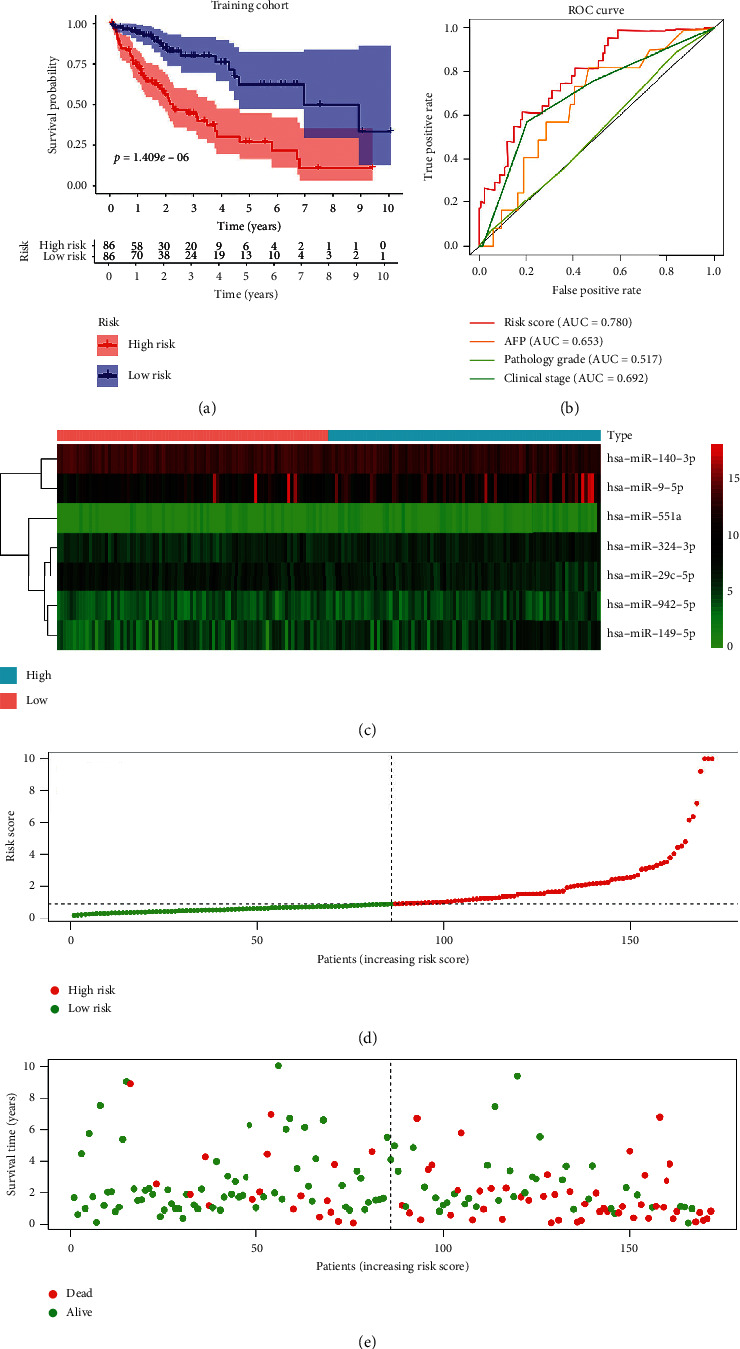
Figure 3.

Risk score of HCC patients in the TCGA training cohort. (a) The Kaplan–Meier survival analysis of HCC patients. (b) ROC curve for the risk score and clinicopathological characteristics of HCC patients. (c) Heatmap of the expression pattern of the seven-MRM signature between high-risk and low-risk groups. (d) Risk score distribution in each HCC patient. (e) The OS and OS status for the high-risk and low-risk groups.
