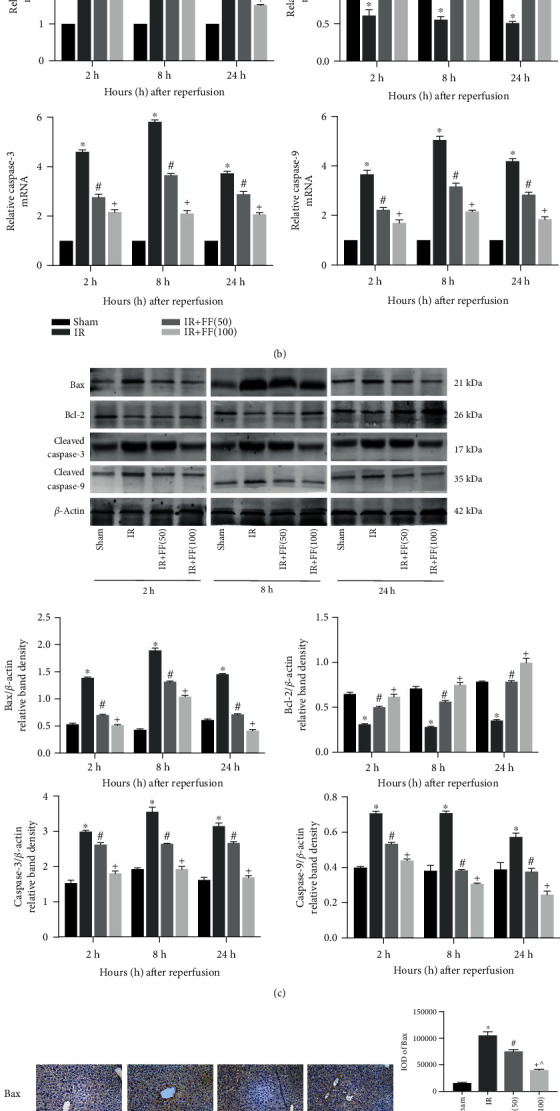
Figure 3.

Fenofibrate attenuated IR-induced apoptosis. (a) After 8 h reperfusion, liver tissues were stained by TUNEL and observed under microscopy (magnification, 200x). Final evaluations were made using Image-Pro Plus 6.0 software to calculate the percentage of positive cells. (b) Relative Bax, Bcl-2, Caspase-3, and Caspase-9 mRNA levels were determined by qRT-PCR. (c) Western blot analysis of Bax, Bcl-2, cleaved Caspase-3, and cleaved Caspase-9 levels. The western blot results were quantified with ImageJ 8.0 software. (d) Bax and Bcl-2 protein expressions in liver tissues at 8 hours after reperfusion are shown by immunohistochemical staining (200x). Final evaluations were made using Image-Pro Plus 6.0 software to calculate the IOD of the positive staining area. Data are presented as mean ± SD (n = 6; ∗P < 0.05 for IR vs. sham; #P < 0.05 for IR+FF (50) vs. IR; +P < 0.05 for IR+FF (100) vs. IR; ^P < 0.05 for IR+FF (50) vs. IR+FF (100)) (reproduced from Ji et al. [19]).
