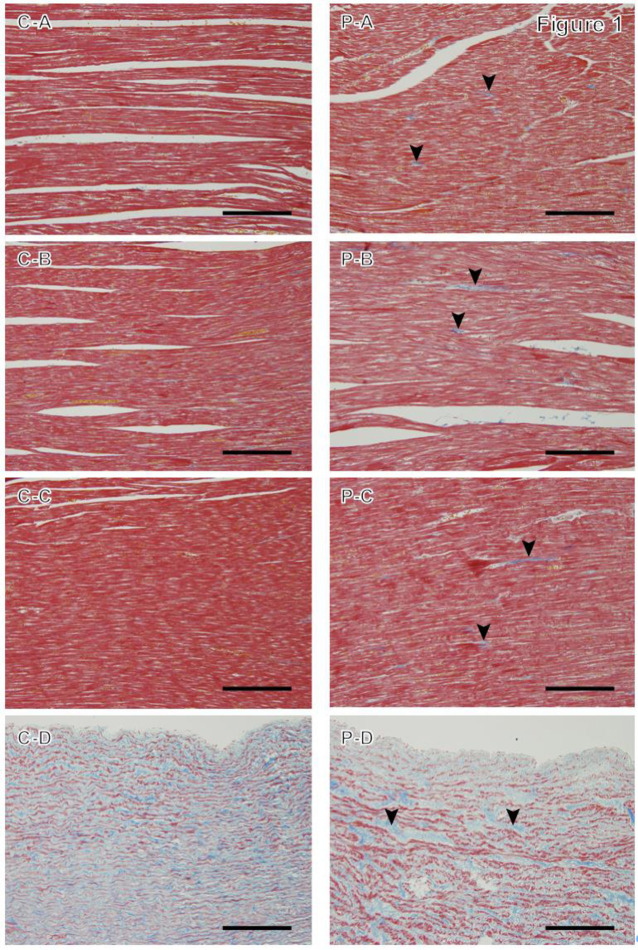
Fig. 1.
Masson’s trichrome staining in the control group (C) and high-dose prednisolone group (P). A: Myocardium of the left ventricular wall; B: myocardium of the right ventricular wall; C: interventricular septum; and D: aorta. The P group shows collagen fibers as thin fibrous structures stained blue at the intramyocardial spaces (arrowheads). Magnification: 200×, scale bar=100 µm.

