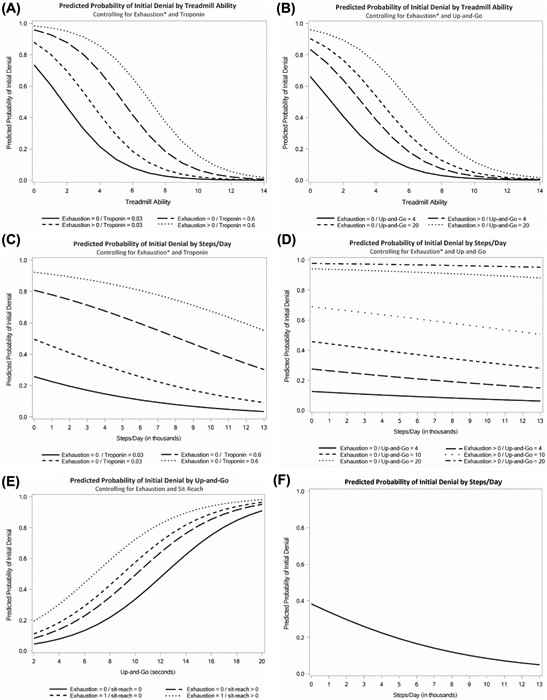
Fig 1.
Predicted probability plots were created at fixed values of 2 model predictors and plotted against the strongest continuous variable in that model to provide an indication of the relative contribution of the individual metrics to the overall model. (A) Probability of denial by treadmill ability, controlling for exhaustion and Troponin T. (B) Probability of denial by treadmill ability, controlling for exhaustion and up-and-go. (C) Probability of denial by pedometer ability (steps per day), controlling for exhaustion and Troponin T. (D) Probability of denial by pedometer ability (steps per day), controlling for exhaustion and up-and-go. (E) Probability of denial, utilizing metrics not dependent on special equipment or lab testing, chair sit-reach, and exhaustion plotted against up-and-go. (F) Probability of denial by pedometer ability (steps per day) alone.

