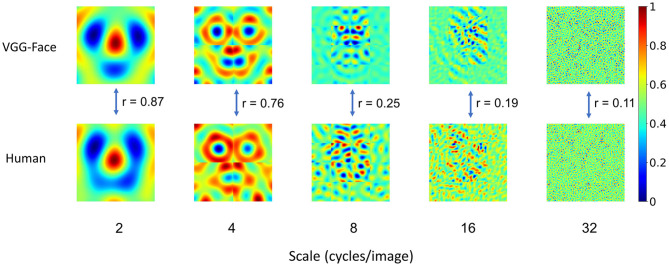
Figure 2.
Correspondence in representation at different scales of spatial frequencies. For visualization, values in each CI were normalized separately to the range from 0 to 1, denoted by colors. Note that the correspondence was the highest at the low-spatial frequencies, and then decreased sharply at the high-spatial frequencies. Scale number denotes cycles per image.

