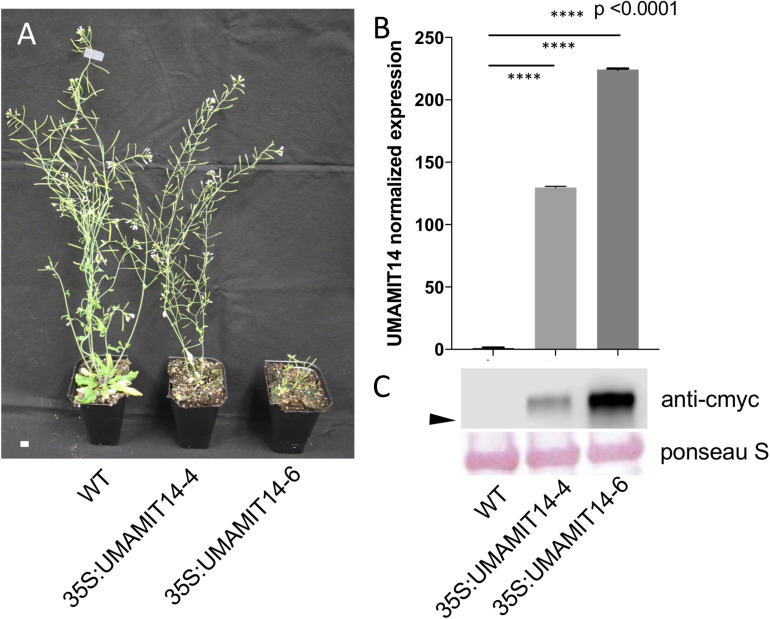
FIGURE 2.
Phenotypes of 35S:UMAMIT14-4 and 14–6 lines. (A) Appearance of WT, 35S:UMAMIT14-4 and 35S:UMAMIT14-6 plants at maturity (12-weeks-old). Scale bar: 1 cm. (B) Relative UMAMIT14 expression levels in 2-week-old seedlings of 35S:UMAMIT14-4 and 35S:UMAMIT14-6 lines compared to the wild type. Statistical significance at p < 0.05 is shown (asterisk) using one-way ANOVA and Tukey’s post hoc tests. Error bars: standard deviation, n = 4.

