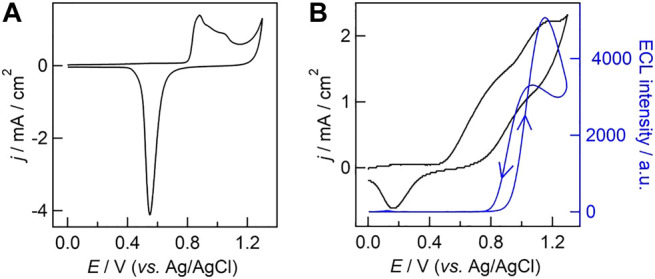
FIGURE 3.

(A) Cyclic voltammogram (CV) obtained with gold-coated UMEA in 0.1 M H2SO4. (B) ECL intensity−potential curve (blue line) overlaid with CV (black line) obtained with gold-coated UMEA in phosphate buffer (PB, 0.1 M, pH 7.4) containing 500 μM Ru(bpy)3 2+ and 25 mM TPrA. The scan rate was 0.1 V/s. The photomultiplier tube was biased at 200 V.
