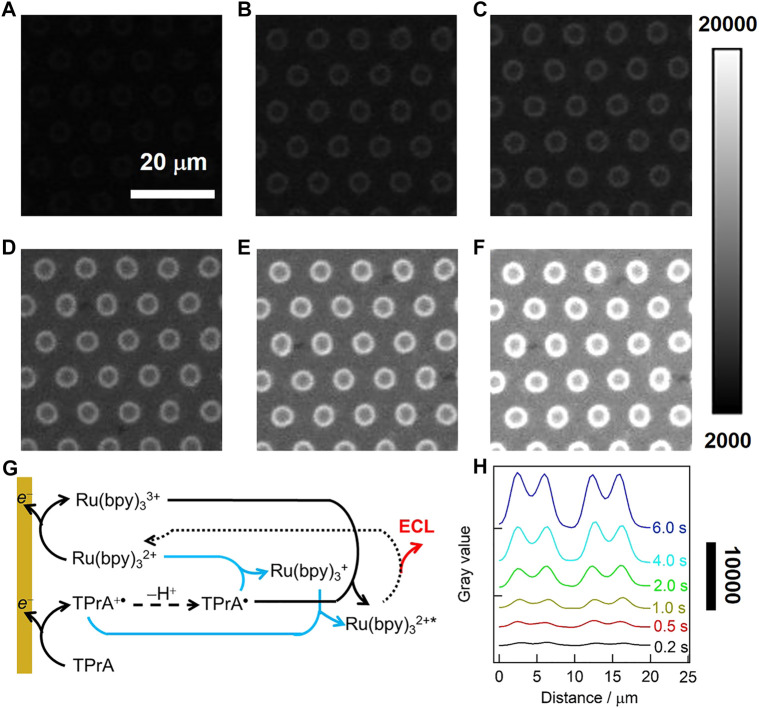
FIGURE 5.
(A–F) ECL images in 0.1 M·PB (pH 7.4) containing 50 μM Ru(bpy)3 2+ and 50 mM TPrA. A double-step potential (initial potential 0 V, pulse potential 1.0 V) was applied to launch the ECL reaction. The pulse time was 0.2 s (A), 0.5 s (B), 1 s (C), 2 s (D), 4 s (E) and 6 s (F). The exposure time of EMCCD was in consistent with the time of the double-step potential. (G) ECL reaction pathways for Ru(bpy)3 2+/TPrA system at a low luminophore concentration. Oxidative reduction route (black line) is concomitant with LOP route (blue lines). (H) The grayscale variation of ECL along the radial direction of two adjacent microwells under different exposure time.

