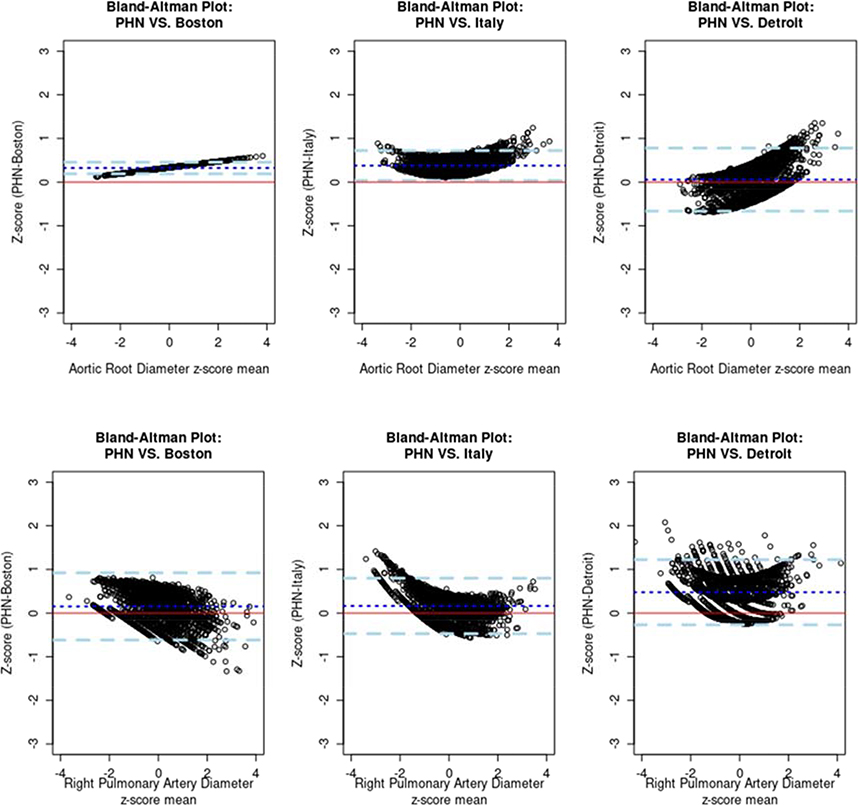
Figure 3:
Bland-Altman plots comparing the PHN Z-scores versus the Boston, Italian, and Detroit Z-scores for the aortic root diameter and the right pulmonary artery diameter. The red line is the 0-reference line and the blue dashed lines are the 95% confidence interval around the mean difference (dark blue dotted line). (PHN = Pediatric Heart Network)

